158 29
The “Reports” section gives you an overview of your customer support performance. You can check your average response time, ticket rating, the volume of tickets you receive, ticket sources, and many more.
In HelpDesk, there are five main types of reports:
- Last 7 days
- New tickets
- Ticket satisfaction
- First response time
- Resolution time
- Handling time by status
- Solved and closed
All reports break down by:
- Teams. Compare how different teams are performing.
- Agents. Explore individual agent performance within teams.
- Overall license. Get a daily breakdown tailored to the type of report you are reviewing.
Note that the “N/A” in the performance breakdown appears in two situations:
- Unassigned: Tickets weren’t assigned to any agent or team.
- N/A: When an agent or team has been deleted, their data is no longer available and won’t be included in the table.
You can also view a daily breakdown of data specific to the report you’re currently viewing.
Last 7 days
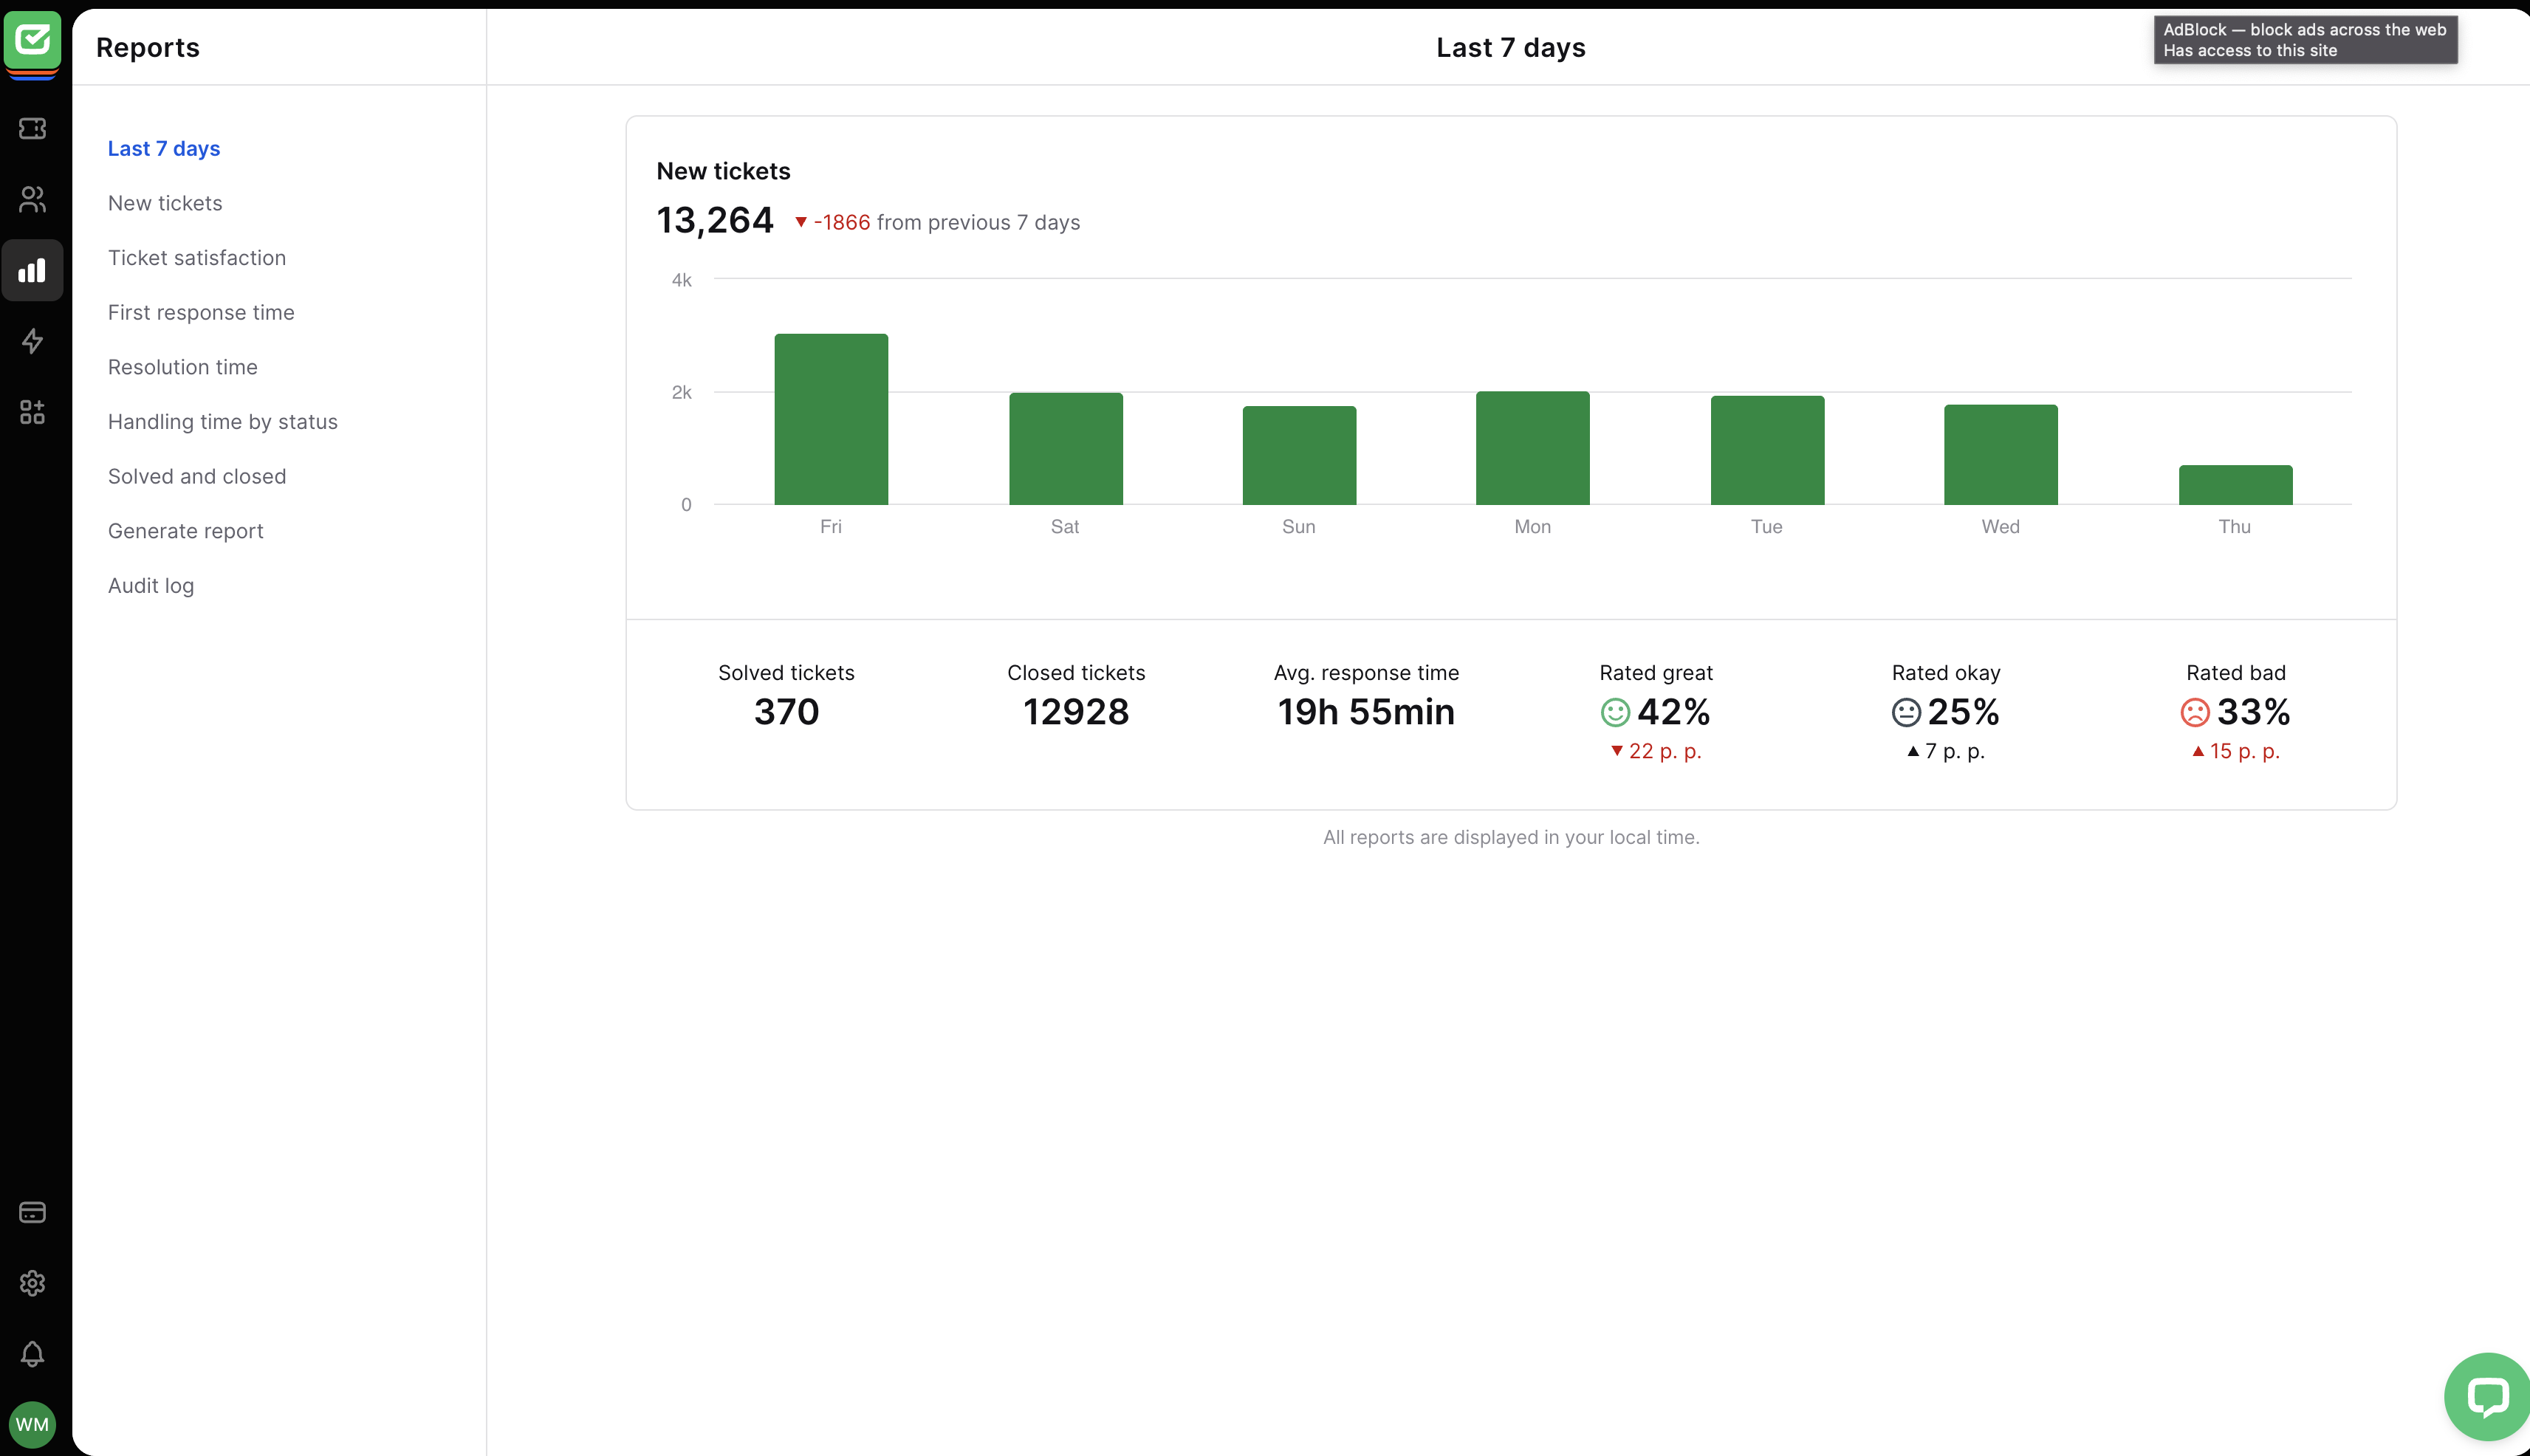
This report displays a summary of the last seven days of your ticket activity. It shows you everything you should know about the new tickets you received last week. You can check out the following details:
- How many tickets you received,
- How many of them were solved or closed,
- What the average response time is,
- How well the ticket responses were rated.
New tickets
In the “New tickets” report, you’ll find three detailed reports. For each report chart, there’s a breakdown at the bottom.
Take a look at the “New tickets” chart to investigate how many tickets you received in a given time frame.

The “Ticket sources” section shows the sources of customer tickets. Four main ticket sources are listed in the chart:
- Created manually
- Contact form
- Chat
- ChatBot
- Contact widget
- Webflow

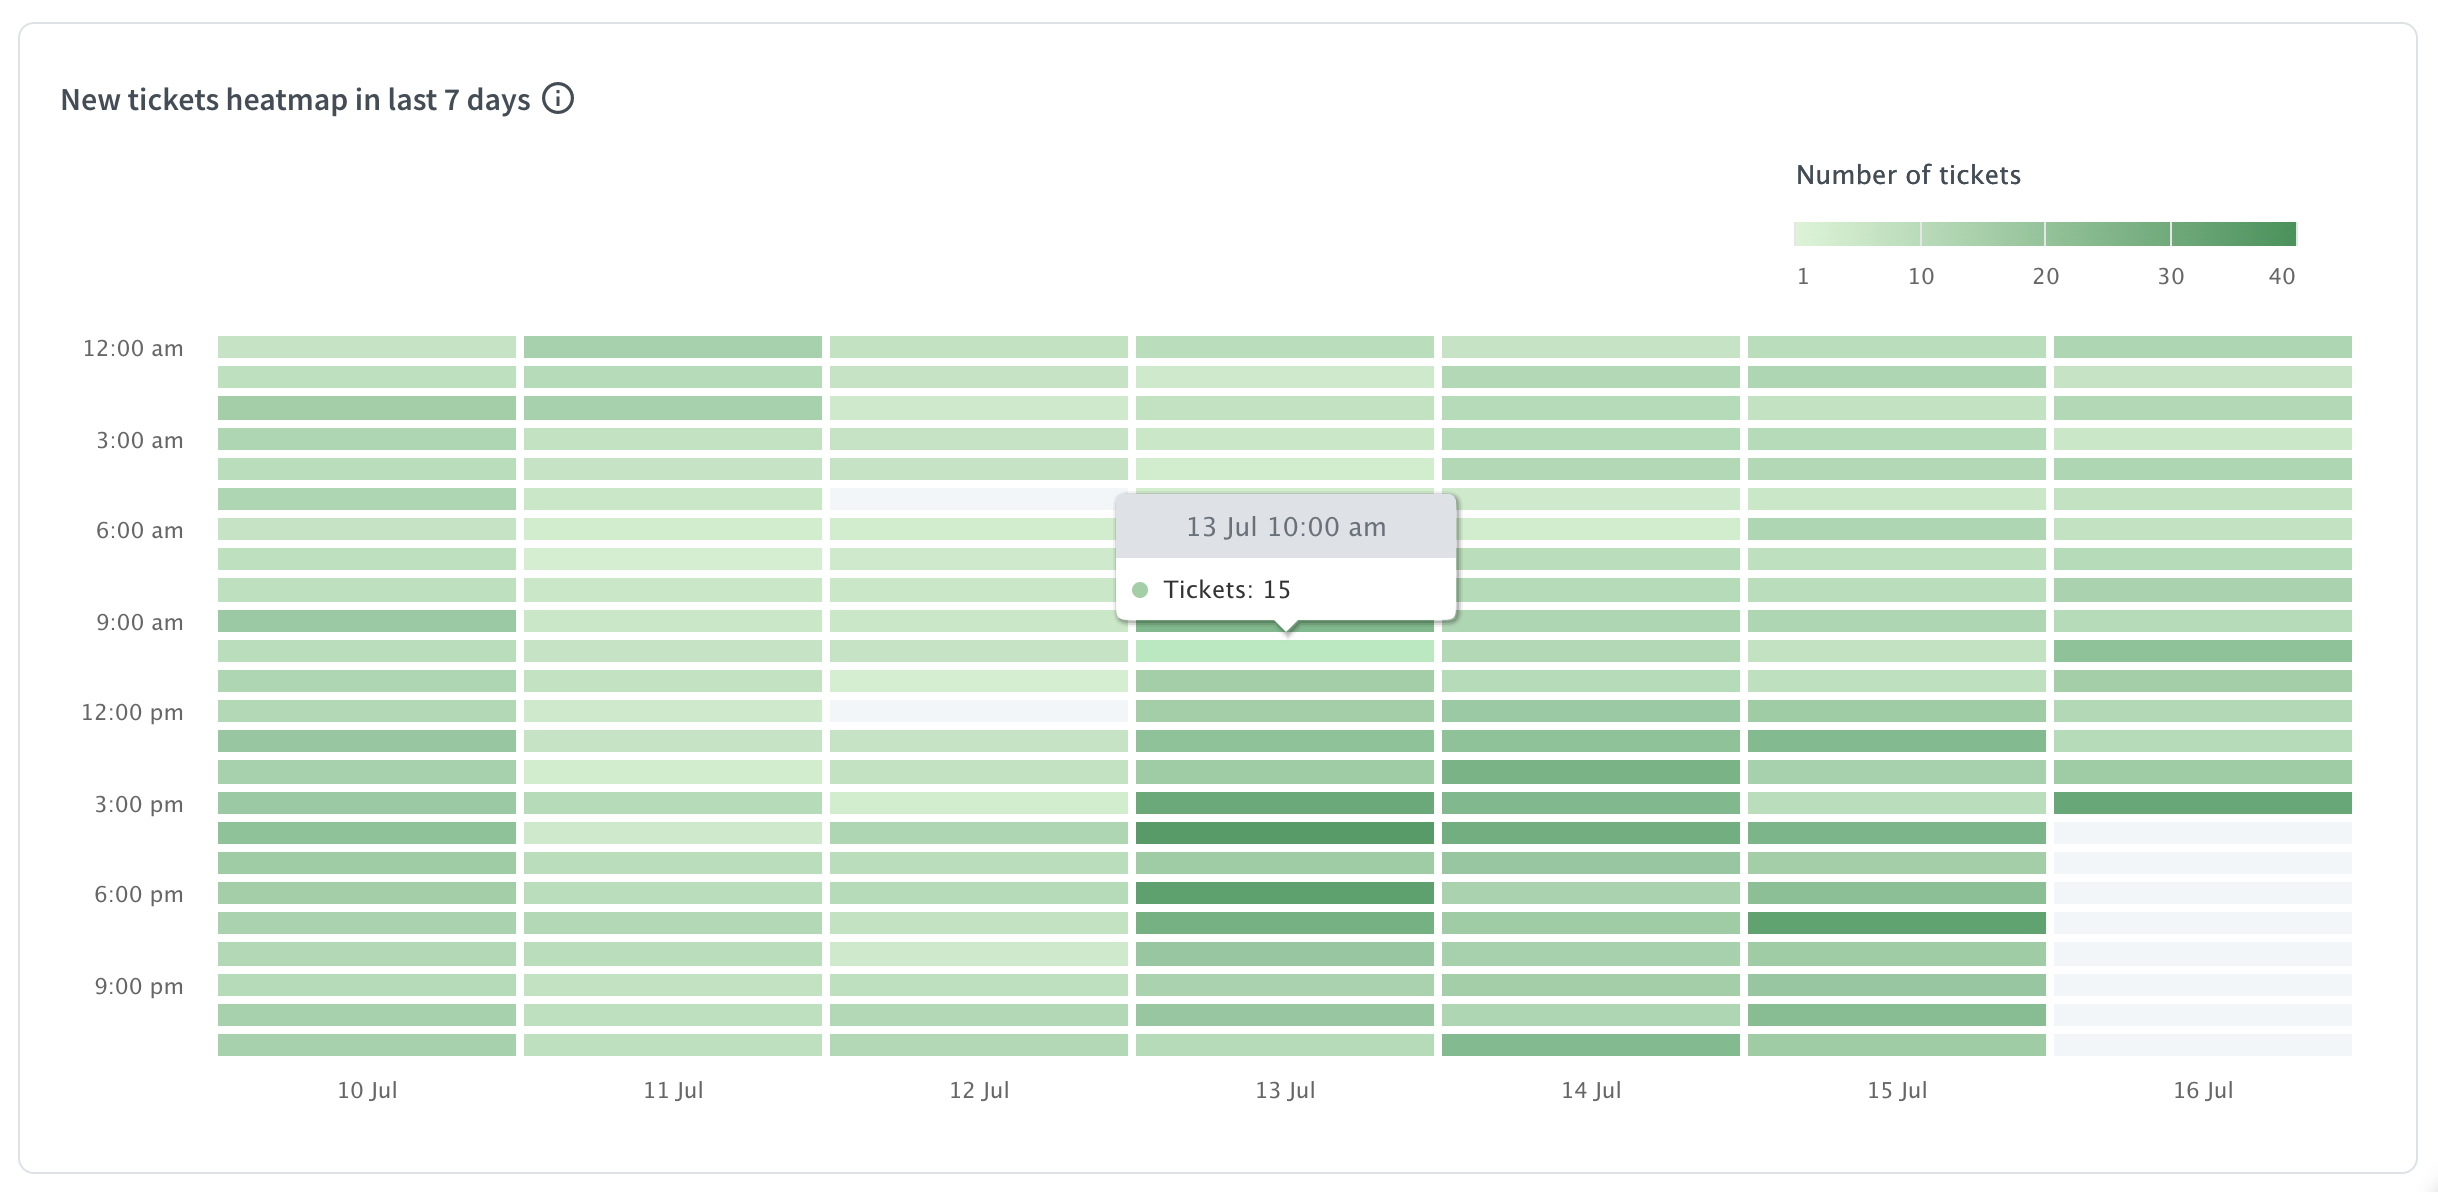
The “New tickets heatmap” is a section that can help you predict how many tickets you’ll receive and how many agents you’ll need to answer them in the future. It gives a graphical summary of the peak times when you receive more tickets than usual.
In the “New Tickets” report, in addition to filtering by date, you can use the following filters to see the performance results you’re interested in:
- Priority
- Tag
- Team
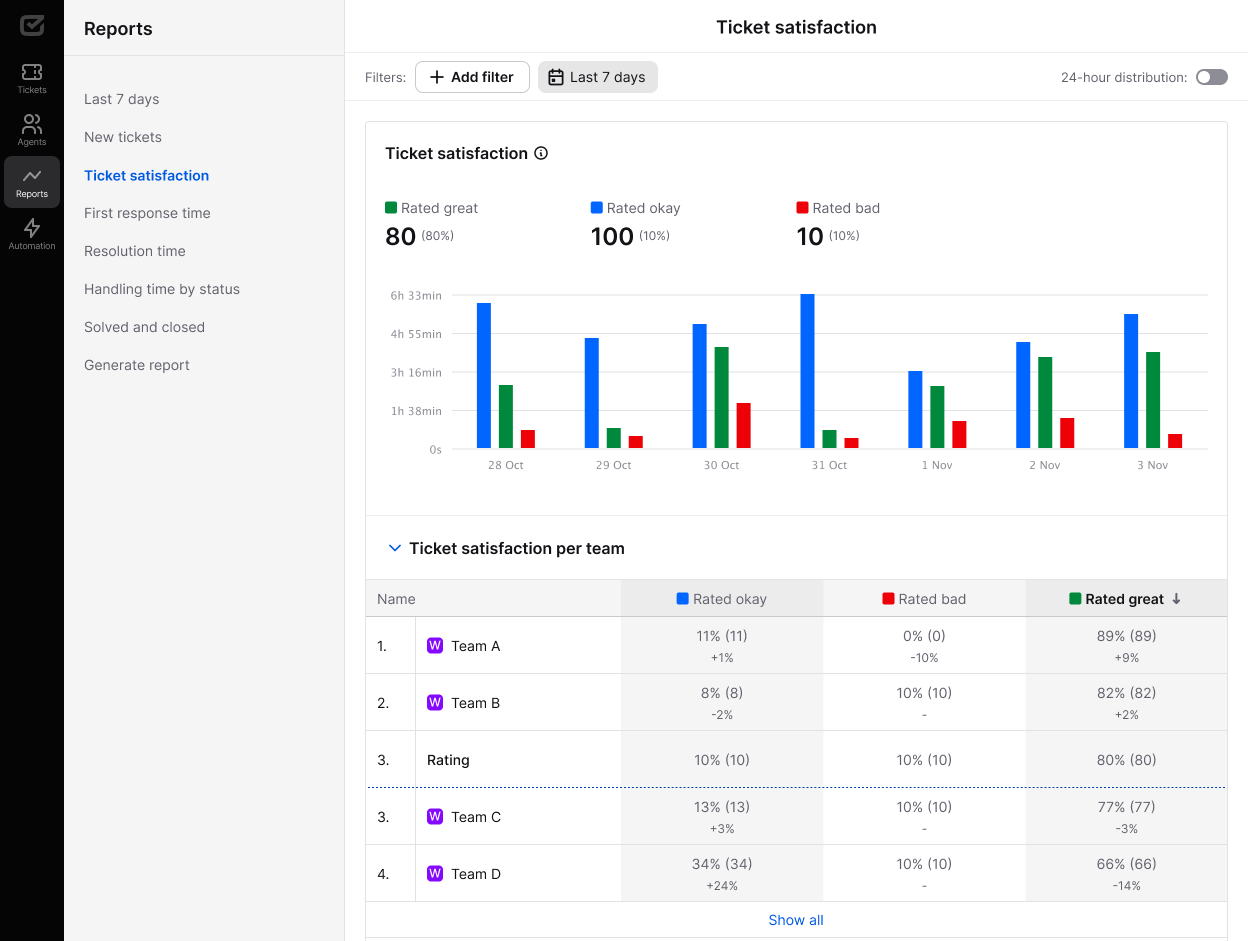
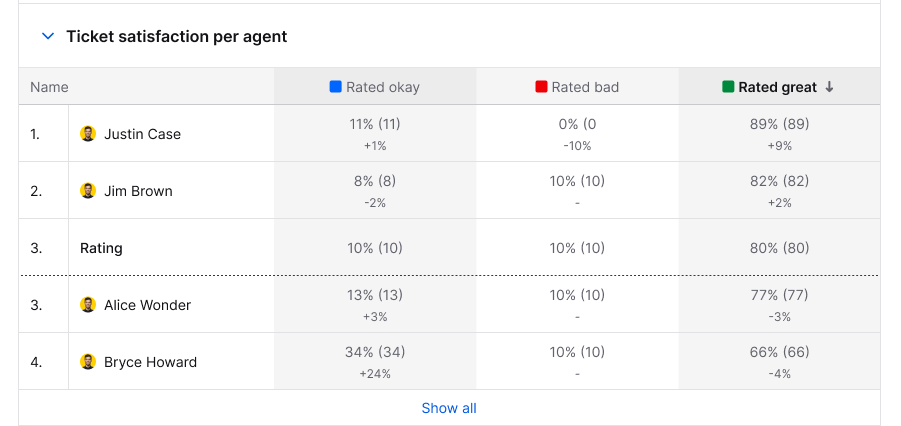
Ticket satisfaction
The “Ticket satisfaction” report gives you an overview of the ticket rating provided by your customers.
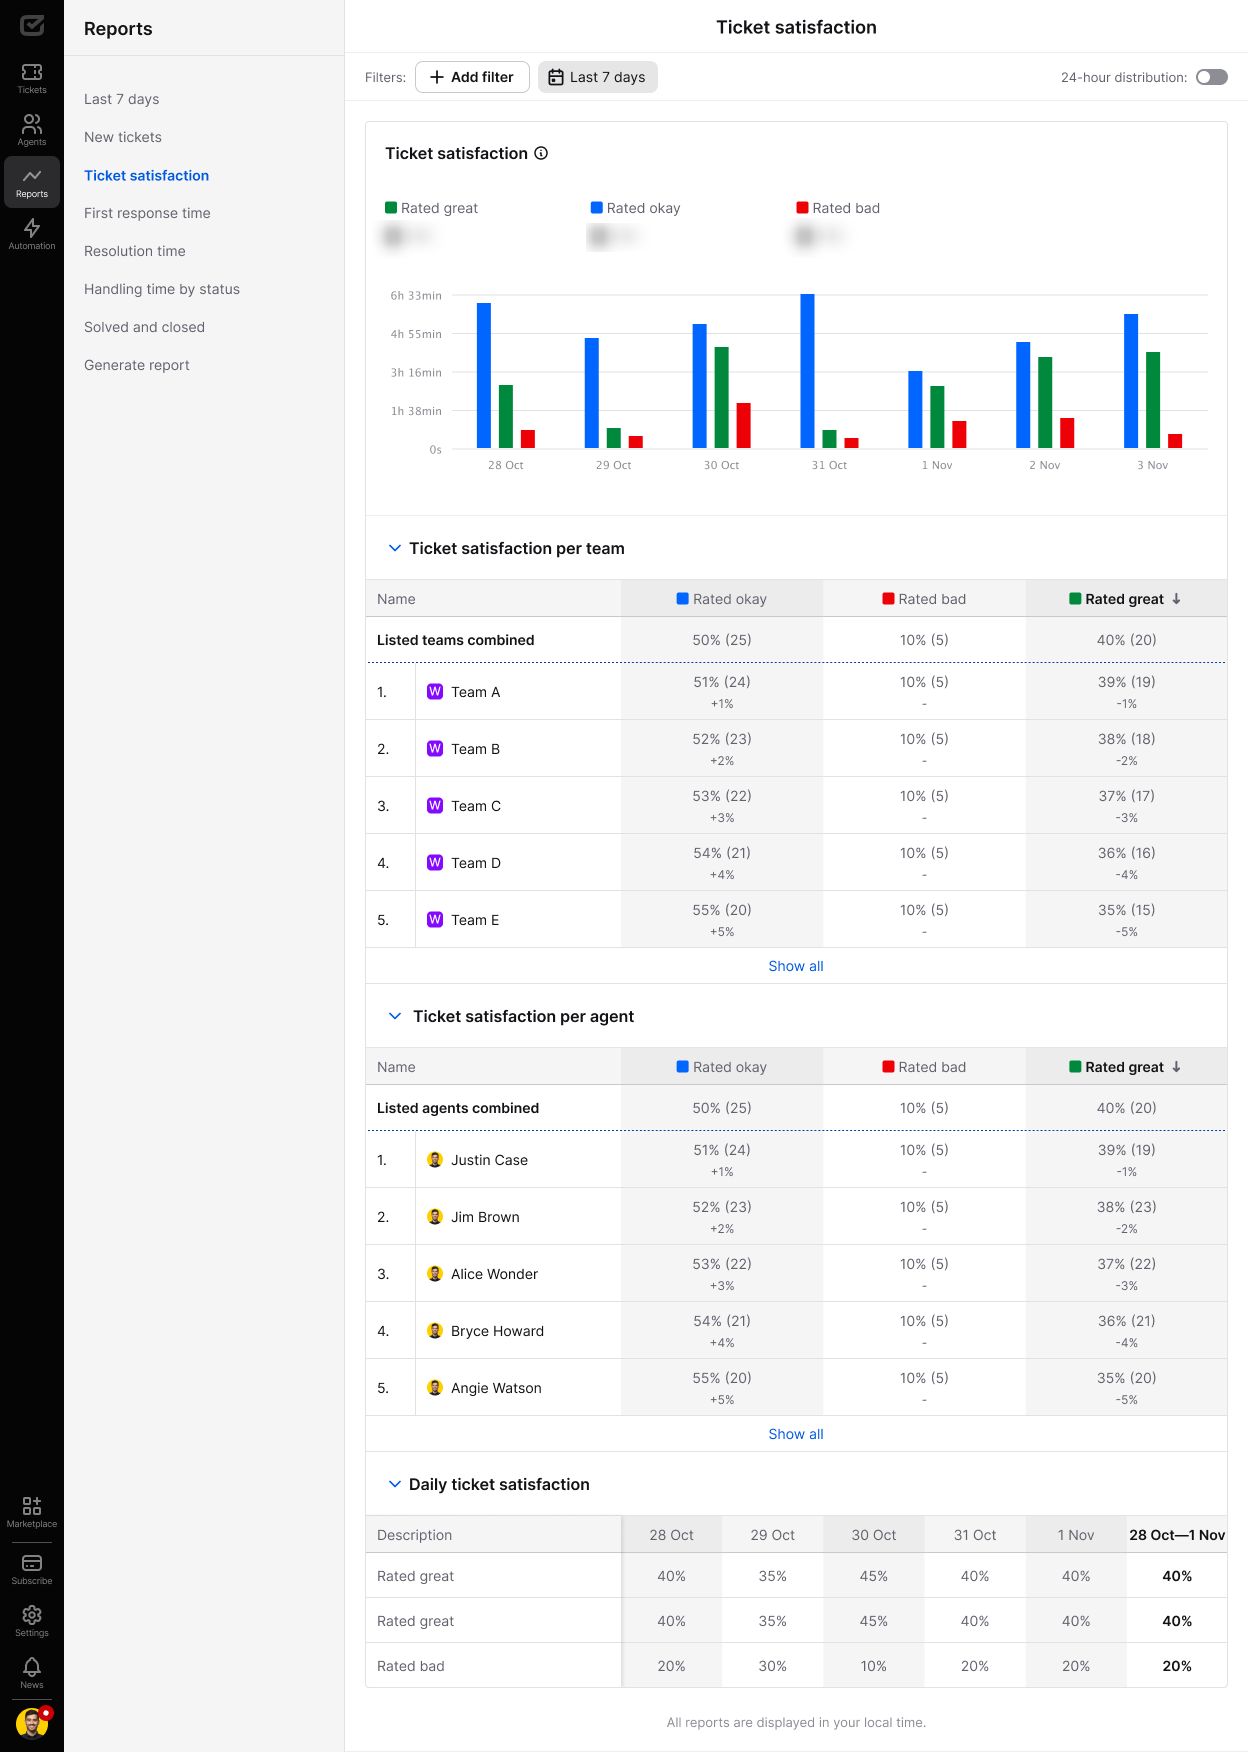
In the “Ticket satisfaction” report, in addition to filtering by date, you can use the following filters to see the performance results you’re interested in:
- Agent
- Priority
- Tag
- Team
- Source
First response time
This report is designed to show you how fast your customer gets a response to their question. The results are based on two key elements: “time to assign” and “time to respond.”
- Time to assign to an agent refers to the time difference between when a ticket is created and when it is assigned to an agent.
- Time to respond measures the time difference between assigning a ticket to an agent and providing the agent’s first response.
With this report, you can track how long your team takes to respond to a ticket and identify areas for improvement.
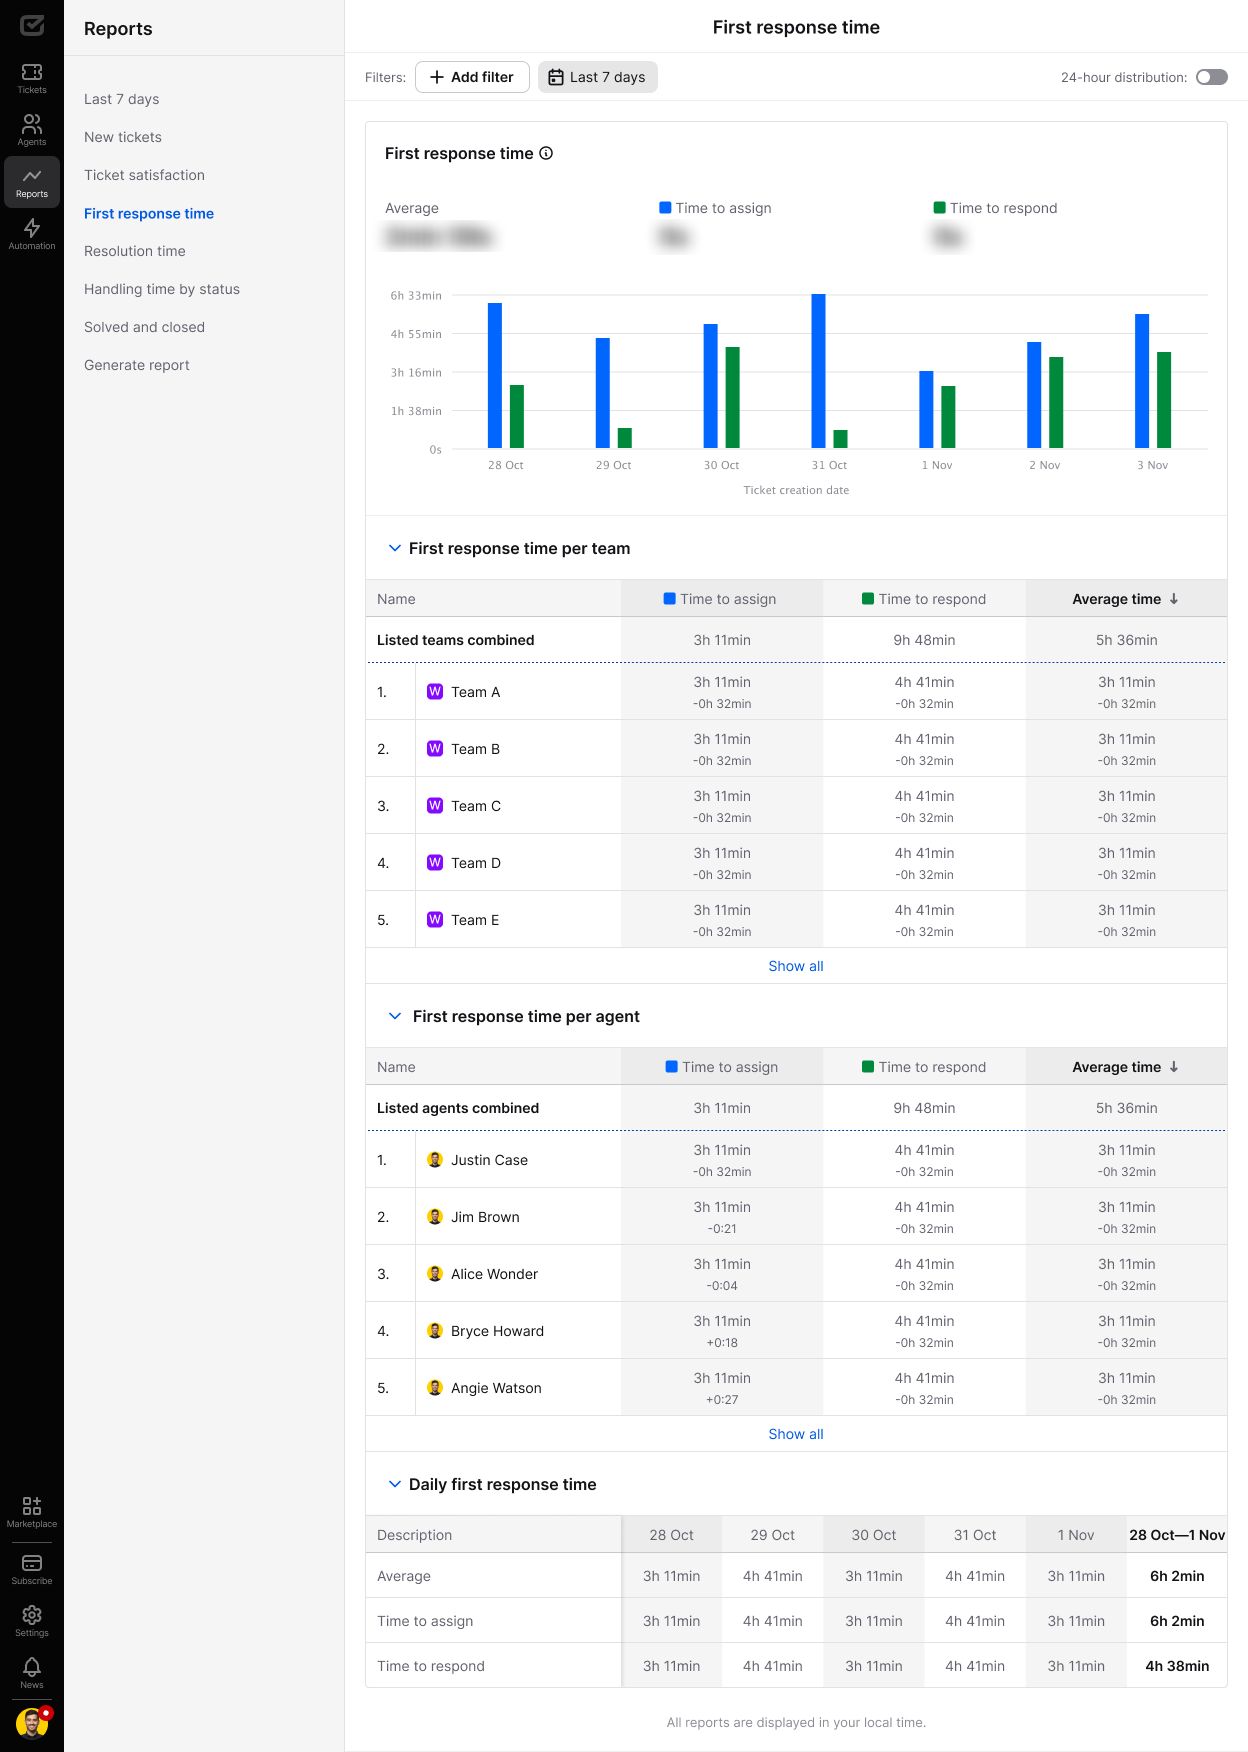
In the “First response time” report, in addition to filtering by date, you can use the following filters to see the performance results you’re interested in:
- Agent
- Priority
- Tag
- Team
- Source
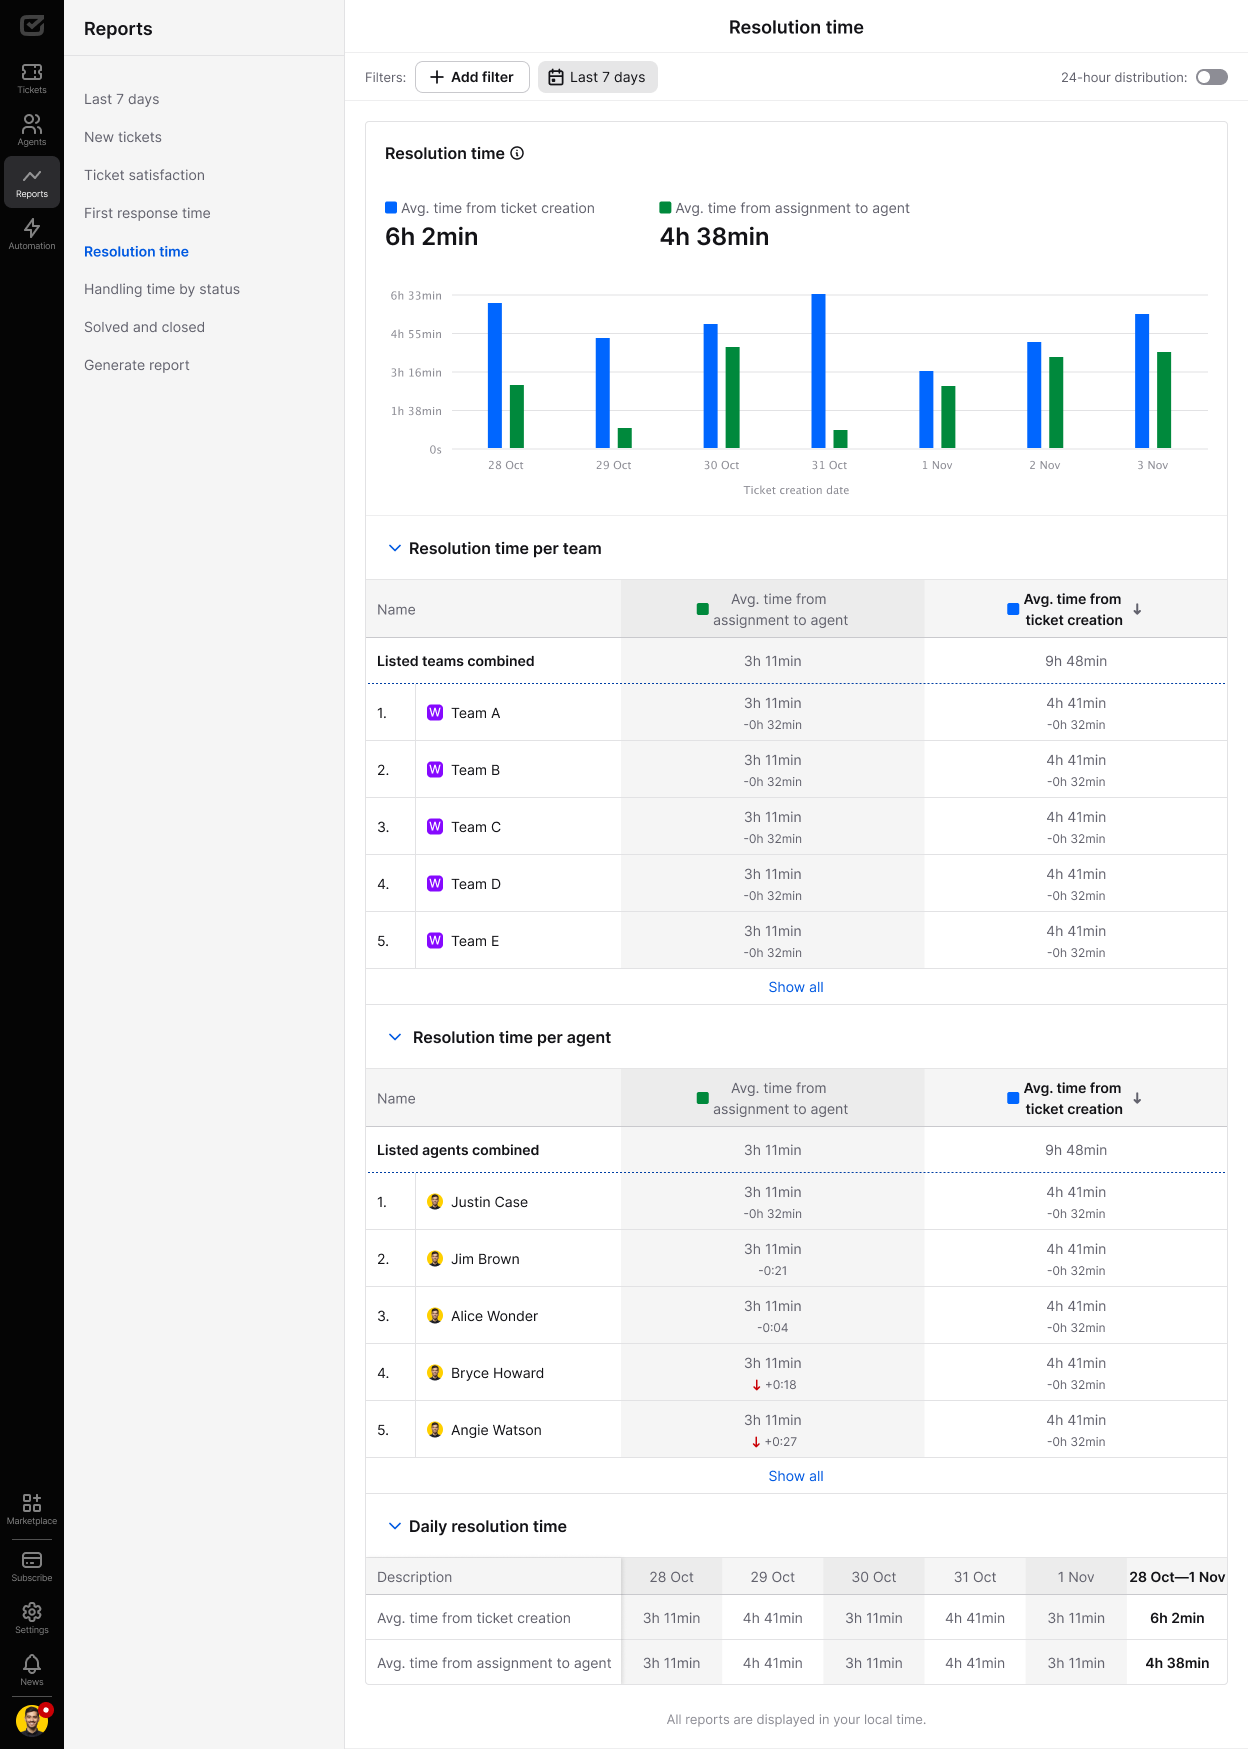
Resolution time
The report shows the average time to resolve or close a ticket from:
- Receiving/manually creating the ticket
- Assigning it to an agent
In the “Resolution time” report, in addition to filtering by date, you can use the following filters to see the performance results you’re interested in:
- Agent
- Priority
- Tag
- Team
- Source
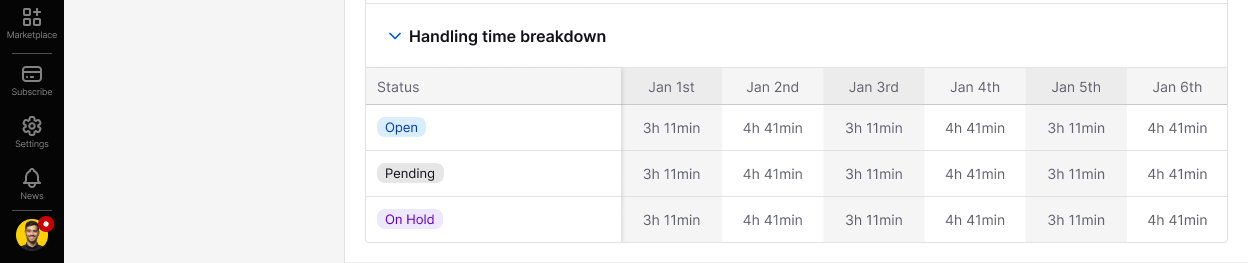
Handling time report
The “Handling time by status” report helps you quickly evaluate how efficiently your teams and agents are managing tickets. This report shows how long tickets spend in the Open, Pending, and On hold statuses, giving you the insights needed to improve response times and customer satisfaction, as well as, guide your teammates.
Use the handling time report to:
- Identify teams or agents with longer handling times.
- Implement process improvements or additional training.
- Monitor how changes impact performance by checking the report regularly.
The report shows the median time tickets spend in three key statuses:
- Open. When a ticket is waiting for an agent’s response or action.
- Pending. When a ticket is waiting for more information from the customer or others.
- On hold. When a ticket is paused, often due to dependencies on other tasks or teams.
Note that this report is sorted by “Resolution time.”
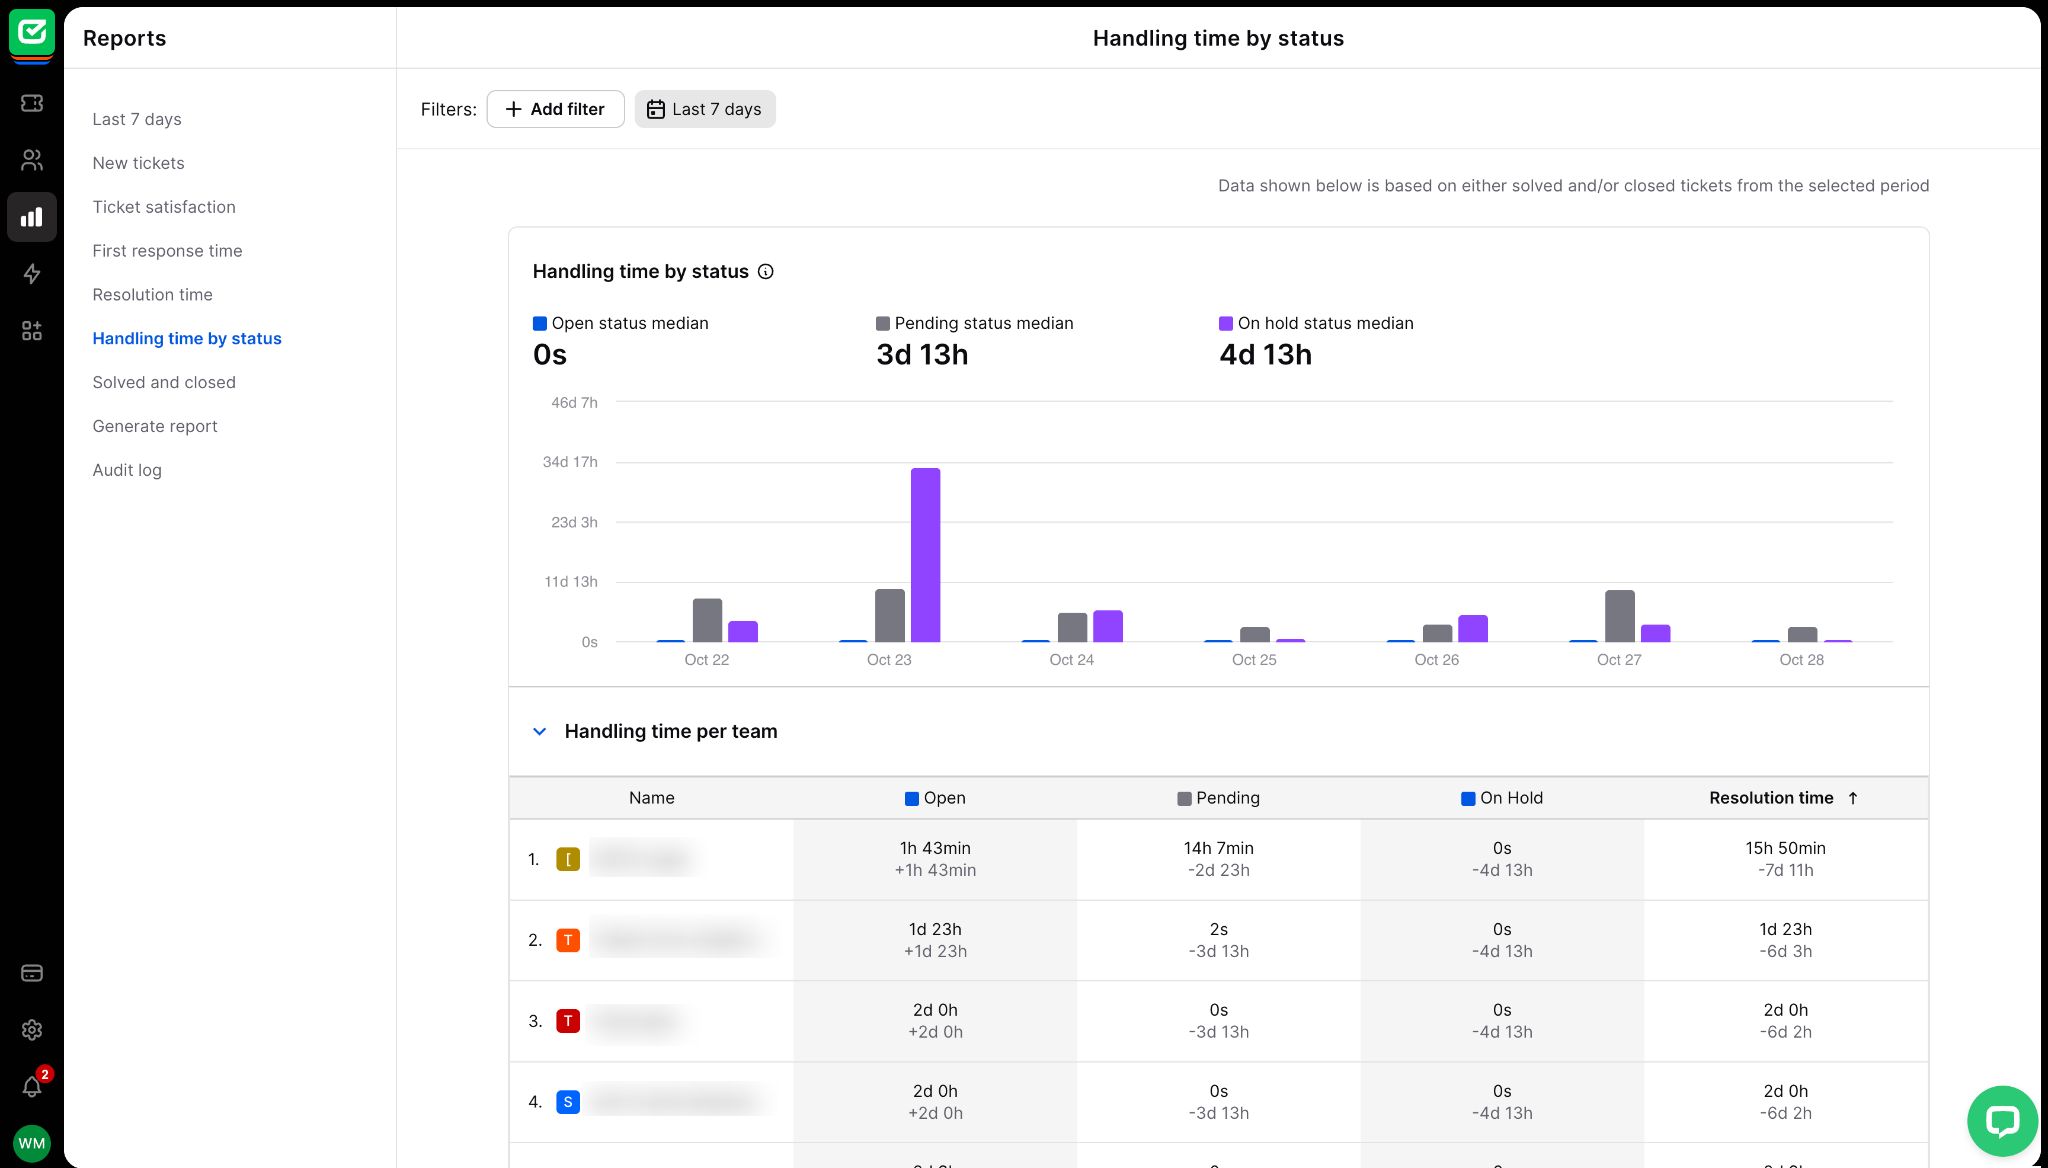
The report uses median times to give you a clear picture without outliers skewing the data.
Filter the report by agent, team, or other variants related to multiple agents or teams. This helps you zero in on the data that matters most to you.

Solved and closed
This report displays the number of solved and closed tickets. You can see how it relates to all the tickets you received. The chart also shows you data segmented by day.
- At the top of the table, you’ll find the total number of tickets that have been solved or closed.
- At the bottom of the table, there’s a figure indicating the difference from the average number of tickets solved or closed.
- In the “Listed agents combined” and “Listed teams combined” section, you can see the average number of tickets solved or closed per agent or team.
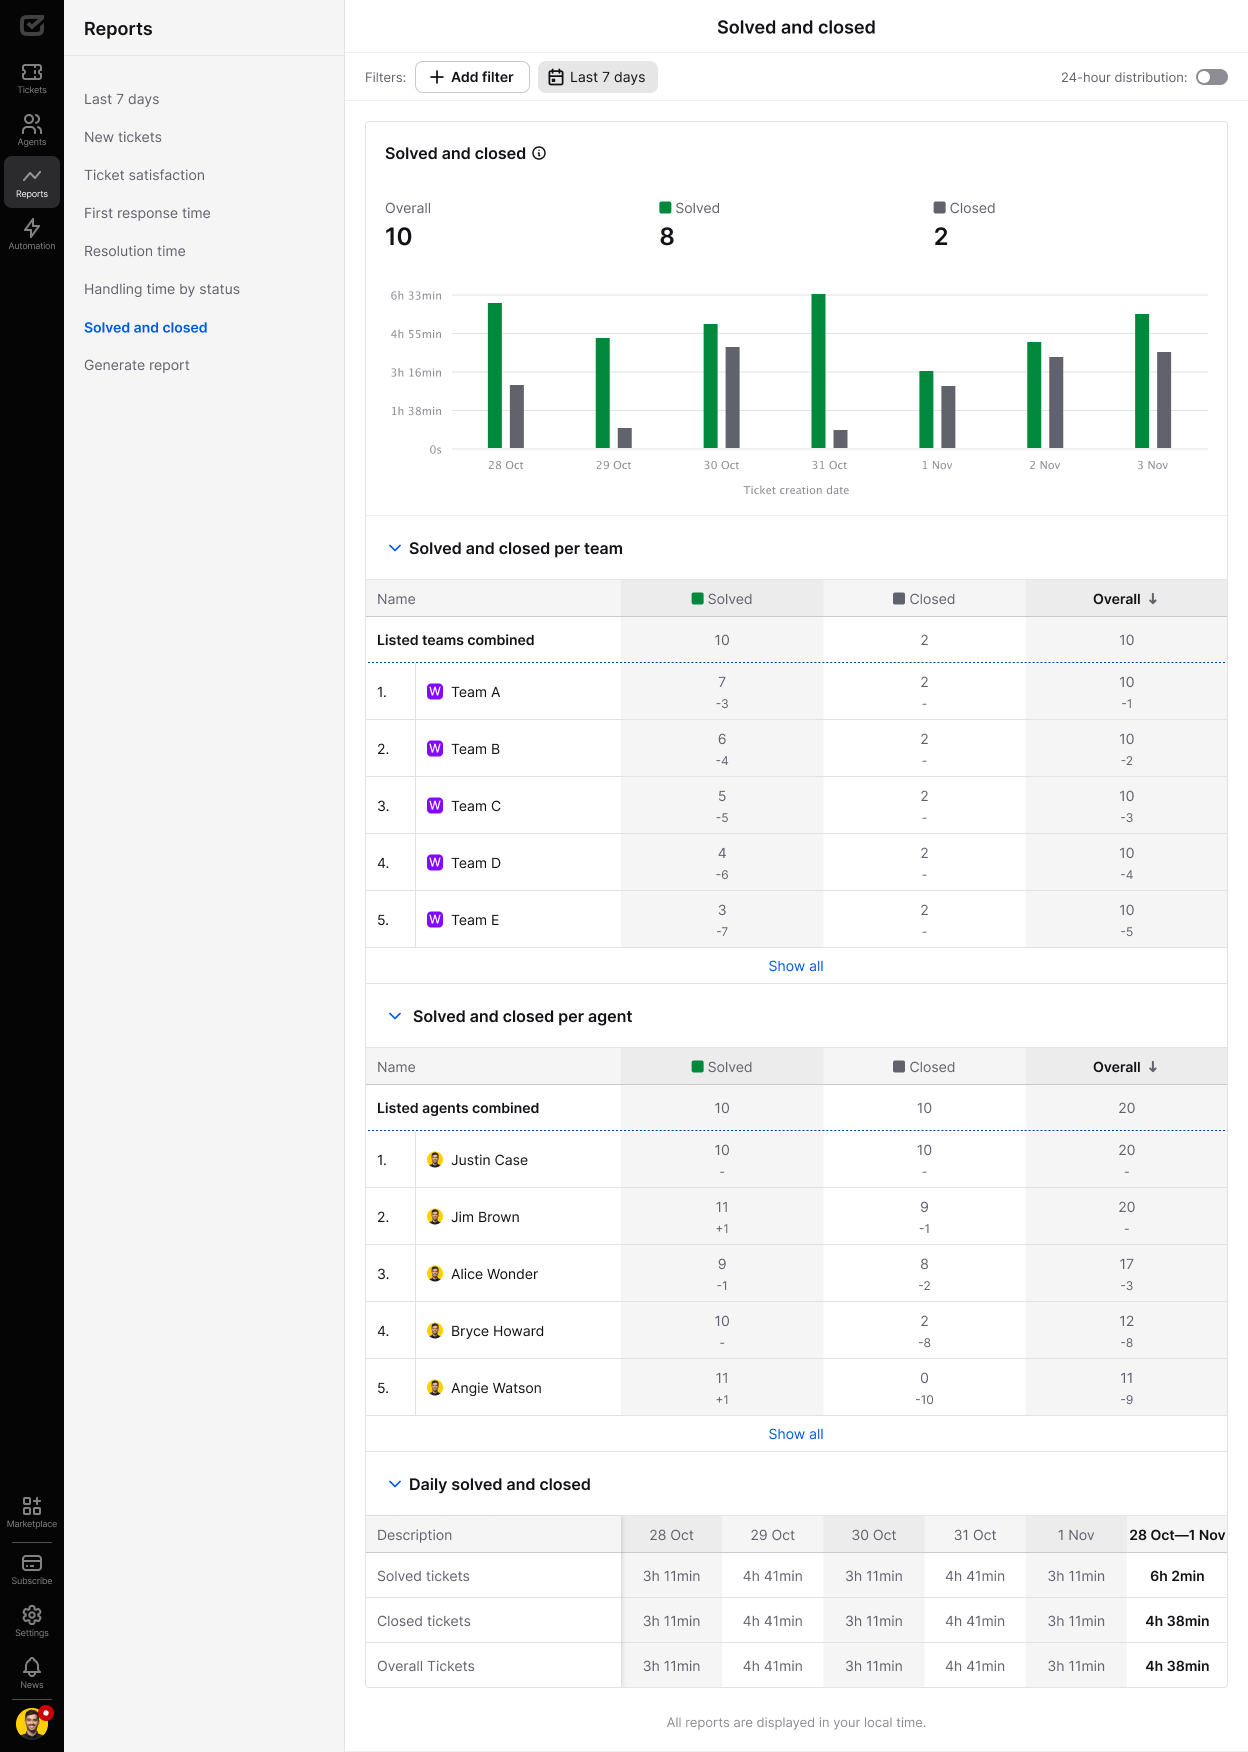
In the “Solved and closed” report, in addition to filtering by date, you can use the following filters to see the performance results you’re interested in:
- Agent
- Priority
- Tag
- Team
- Source
Reports export
Admins can generate detailed performance reports and have them sent to designated email addresses.
There are two types of reports available for export:
- Ticket performance report – includes data about all tickets within the selected time period.
- Agent performance report – shows agent activity based on how they handled tickets created within the selected time period.
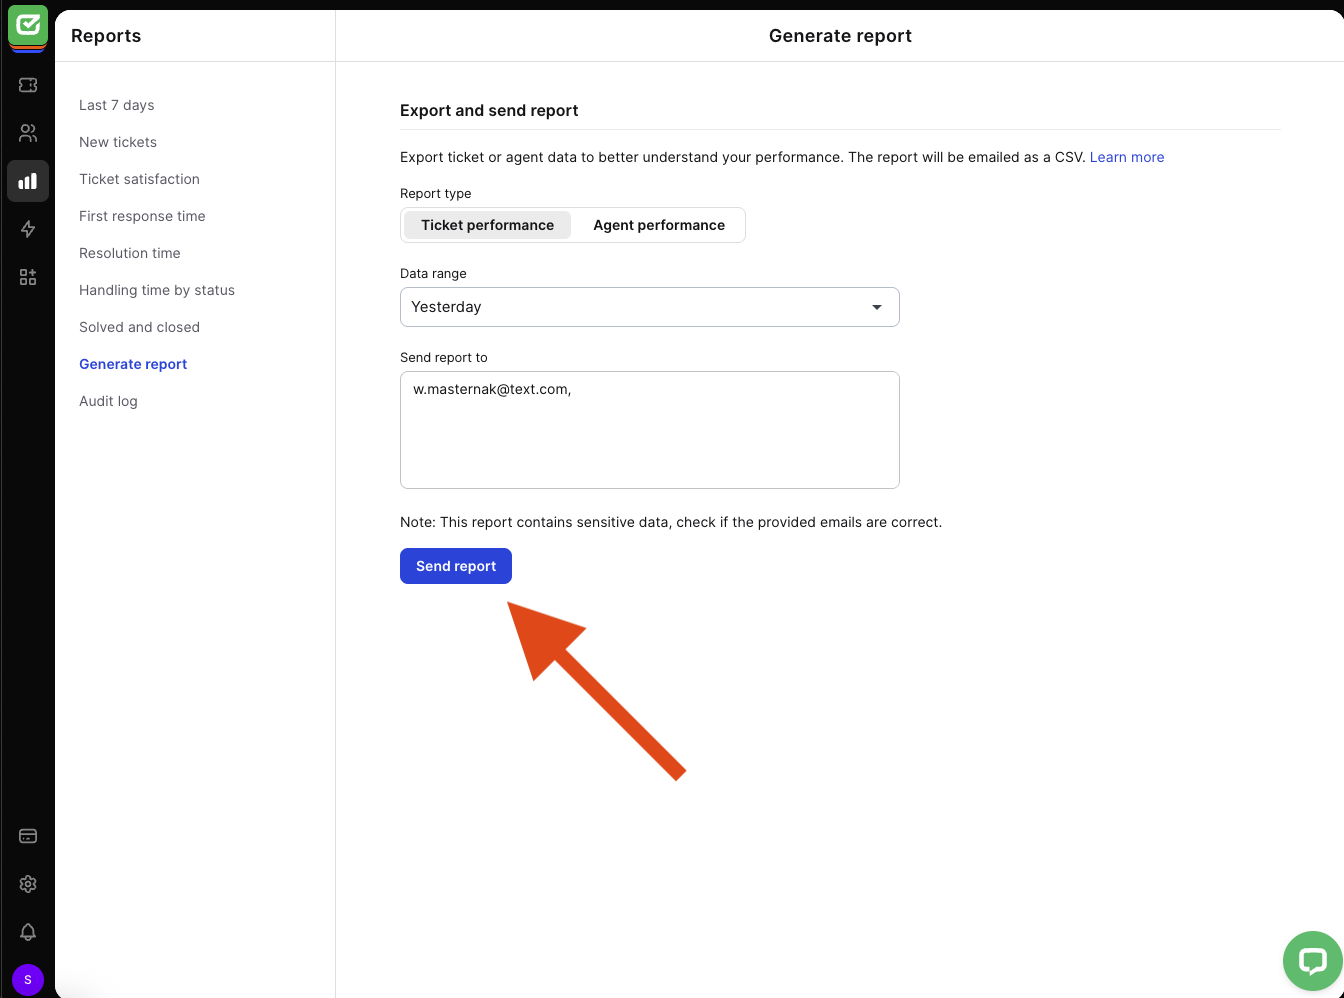
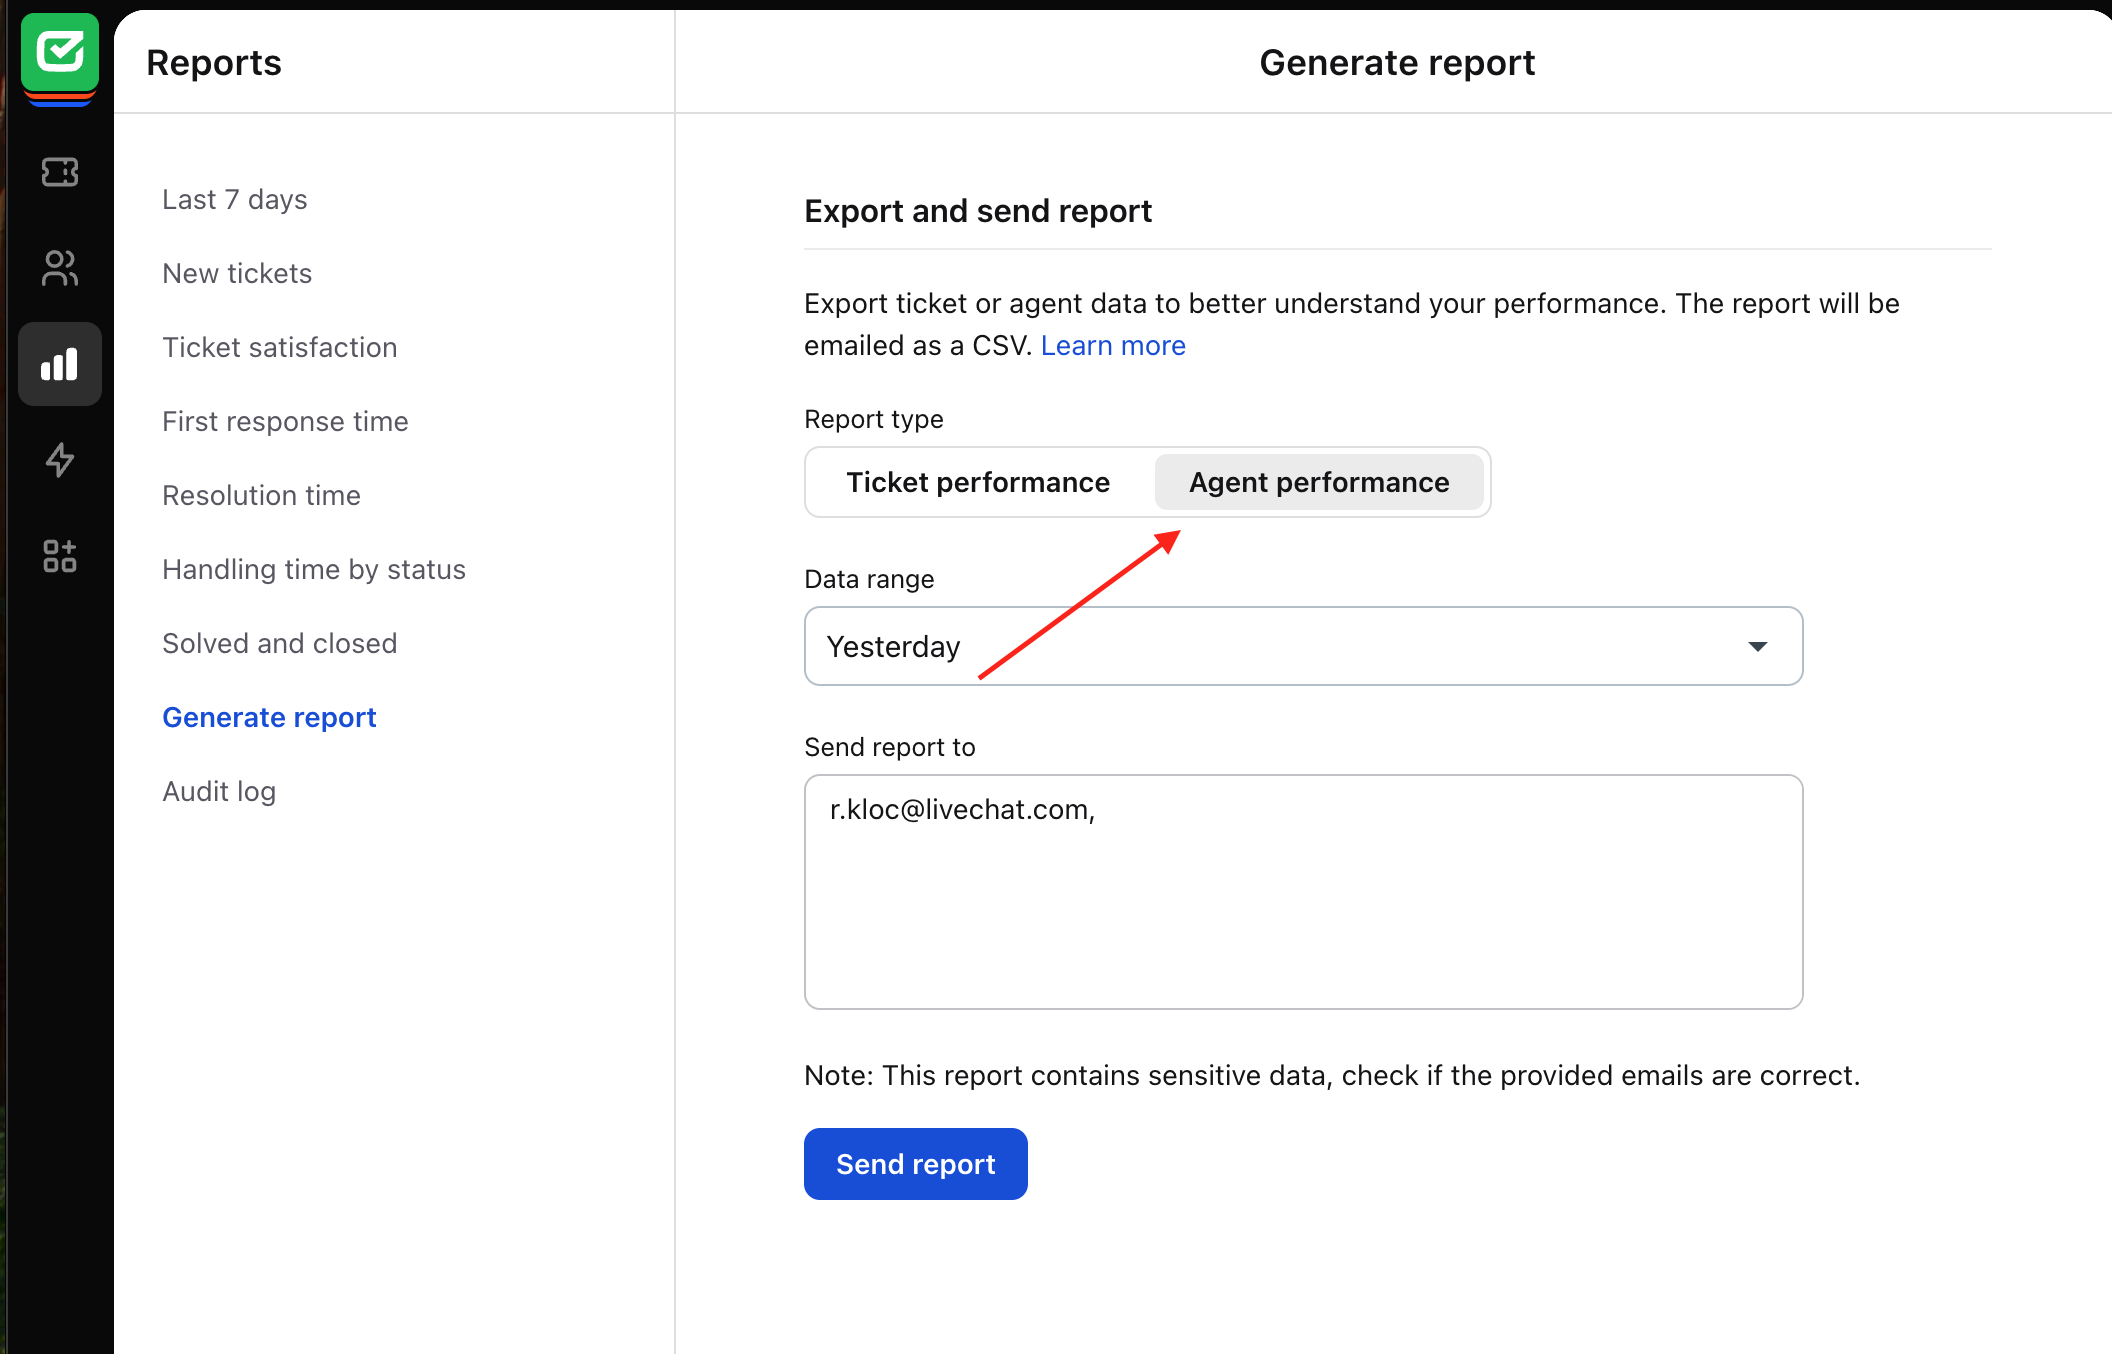
To generate a report, go to the Reports section and find “Generate report.”
Then:
- Choose the report type (Ticket performance or Agent performance).
- Select the desired date range:
-
- Yesterday
- Last 7 days
- Last month
- Custom period
- Add one or more email addresses to send the report to.
- Select “Send report.”
A link to download the CSV file will be sent to the specified address.
Ticket performance report
This report contains information about all tickets created within the selected time frame. It provides a CSV file with detailed data about ticket activity, including fields such as ticket ID, creation date, status, tags, priority, assignee, and more.
You can use it to analyze trends, response times, and workload distribution across your HelpDesk account.
Agent performance report
This report shows activity from the agent perspective, based on tickets created within your selected time frame.
For example, if you generate a report for yesterday, it will include all tickets created yesterday — but the data will reflect how individual agents interacted with those tickets (e.g., how many they responded to, reassigned, tagged, or closed).
When generating a report, select Agent performance as the report type.
The resulting CSV file will include detailed agent-level metrics, such as:
- agentID - Unique identifier for the agent in the ticketing system.
- agentName - Full name of the agent.
- agentEmail - Email address of the agent.
- ticketsWithAnyMessage - Number of tickets where the agent posted any type of message.
- ticketsWithPublicMessage - Number of tickets where the agent posted a public message visible to customers.
- ticketsWithPrivateMessage - Number of tickets where the agent posted a private/internal message.
- messages - Total number of messages sent by the agent.
- publicMessages - Number of public messages sent by the agent.
- privateMessages - Number of private/internal messages sent by the agent.
- ticketsWithTagsAdded - Number of tickets where the agent added one or more tags.
- ticketsWithTagsModified - Number of tickets where the agent changed existing tags.
- messagesWithCannedResponse - Number of messages sent by the agent that used a canned (pre-written) response.
- ticketsWithCannedResponse - Number of tickets where the agent used at least one canned response.
- ticketsAssignedTo - Number of tickets assigned to the agent by others or the system.
- ticketsWithTeamChanged - Number of tickets where the agent changed team
- ticketsTeamChanges - Number of teams changed by agent
- ticketsAssignedBy - Number of tickets the agent assigned to others.
- ticketsWithStatusChanged - Number of tickets where the agent changed the status (e.g., open, closed).
- ticketsWithPriorityChanged - Number of tickets where the agent modified the priority level.
- ticketsSummarized - Number of tickets where the agent added a summary.
- ticketsFollowed - Number of tickets the agent chose to follow or monitor.
- ticketsWithFollowersAdded - Number of tickets where the agent added one or more followers.
Team plan users who accessed the export feature within the last 30 days continue to have access. Admins can enable or disable access for specific licenses as needed.
Weekly reports
Every Monday, you can receive a support performance report in your inbox. This weekly report gives you an overview of your achievements in one email message.

If you want to get this report, you need to go to your individual account details and enable the “Send me weekly summary emails” option.