


Busy supporting customers? Not anymore.
Watch hands-on webinar on workflows and easily automate your work in just five minutes!
Customer service is a discipline that relies on human interactions. If you want to elevate your customer assistance and make it exceptional, you need to establish a ground floor of “hard numbers.” We LiveChat professionals are well aware of this, which is why we collect all the customer service trends and statistics in our interactive LiveChat Customer Service Report. It’s always up to date and filled with the latest and most inspiring findings. The report also makes it clear: Tracking performance and drawing insights from every move is essential in any business.
There are many articles on the internet with titles such as “30 Customer Service Metrics You Need to be Measuring.” Well, I’m already overwhelmed when I read such a headline. Do I really need to know and track all 30 of them? No way.
I decided to put together just five of the most important ones so that you can commit to tracking your results. Now, in the following paragraphs, you’ll learn what customer support metrics are and how to measure the five most powerful ones. Let’s dive in!
Customer service metrics are measurable values that show the support team’s performance in terms of efficiency, speed, and workload. They also show what progress has been made towards defined business goals.
If you weren’t tracking the results of your work, would you be able to tell if you were doing it right? Definitely not — because you can’t improve what you don’t measure. That’s why it’s so important to get a numbers-based perspective. Find customer care metrics that suggest you’re moving in the right direction and growing.
It’s crucial to have a set of metrics to track the support team’s performance or identify areas for growth and improvement. Now, analyze your customer service workflow and ask yourself a few questions before formulating the final metrics. Such questions can be, for example:
What is my average handle time and the average resolution time?
How about my ticket resolution rate?
Which support categories absorb the most human resources on my team?
What is my average response time?
Are my customers satisfied with my service?
How many “unresolved” or “on hold” tickets do I have each month?
These questions can help you to identify opportunity gaps and guide you to better allocate available company resources.
📈 Easily get answers to all these questions by applying HelpDesk to your daily processes. View reports and know what's new!
Sign up for the 14-day free trial!
Each set of customer support metrics should be personalized and focused on the activities that add the most value to the business. Since I deal with a customer service team every day, I’d say that these three categories of metrics truly stand out:
Productivity metrics. They help you understand the amount of work done by your team or individual agents, for example, the ticket volume, ticket resolution rate, tickets solved by the first support line, and the total number of unresolved tickets.
Performance metrics. They help you realize the time required to resolve customer cases, for example, the average resolution time or first response time.
Experience metrics. They help you know the impact you are having on your customers, their perception of your brand, and their comfort when interacting with you, for example, Customer Effort Score, Net Promoter Score, and Customer Satisfaction Score.
Once you’ve selected the leading metrics for customer care, keep in mind the correlations between them as you analyze them.
In the lesson on customer support work planning, I pointed out that your goals should be SMART. The same goes for your metrics. Customer service metrics should follow SMART guidelines, meaning they must be Specific, Measurable, Attainable, Relevant, and Timely.
🔬 Make SMART decisions based on the data you collect while serving your customers. Use HelpDesk to become an informed expert.
Also, I need to add that you should look at customer service as a bundle of different activities that contribute to the overall customer experience. Each action, be it customer service, product management, sales, or marketing, affects the others. In addition, typically, none of the metrics show a clear cause-and-effect relationship. Let me clarify why this is the case.
For example: Is your customer retention rate high because your support team does a great job and is helpful? Or maybe it’s because your product is excellent and there are no complaints? Or perhaps it all depends on sales scripts and marketing materials that are well executed and leave the customer with no questions? As you can guess, all of these factors can affect your customer service metrics.
Now, let’s review some proven benchmarks and create a well-balanced set of customer service metrics for your business.
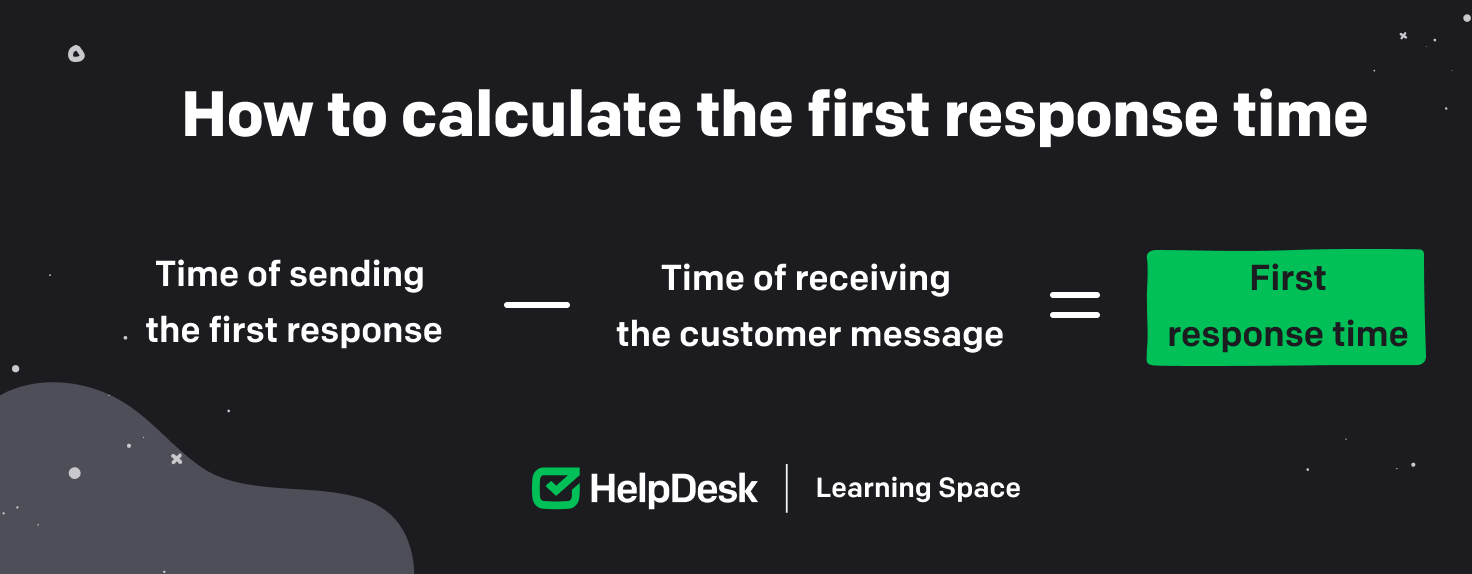
First response time is the time that passes between a customer sending a message and receiving the first response from a customer service agent. This time can be counted in minutes, hours, or even days depending on:
Communication channel. It’s quicker to reply to synchronous messages, such as chat messages, than asynchronous, such as email messages.
Internal rules and priorities. Teams can handle customer tickets differently depending on the issue type or customer type they’re dealing with.
Time of sending the first response MINUS Time of receiving the customer message = First response time
This calculation will give you a first response time rate specified in minutes, hours, or days.
 I chose to mention the first response time metric upfront because it shows today’s customer expectations. They want to be served quickly, preferably as soon as they send a message to your customer service agent. The HubSpot research shows that 33% of customers are most frustrated by having to wait on hold. Nothing surprising about that. So, the less time it takes you to send your first response, the better impression you’ll make.
If you sign up for HelpDesk, you’ll see a clear and easy-to-understand “First response time” report in our Reports section. There are two main categories of actions:
Time to assign to an agent
Time to respond
If you become proactive with HelpDesk, you’ll be able to see these results in the report, and then based on that, take corrective actions.
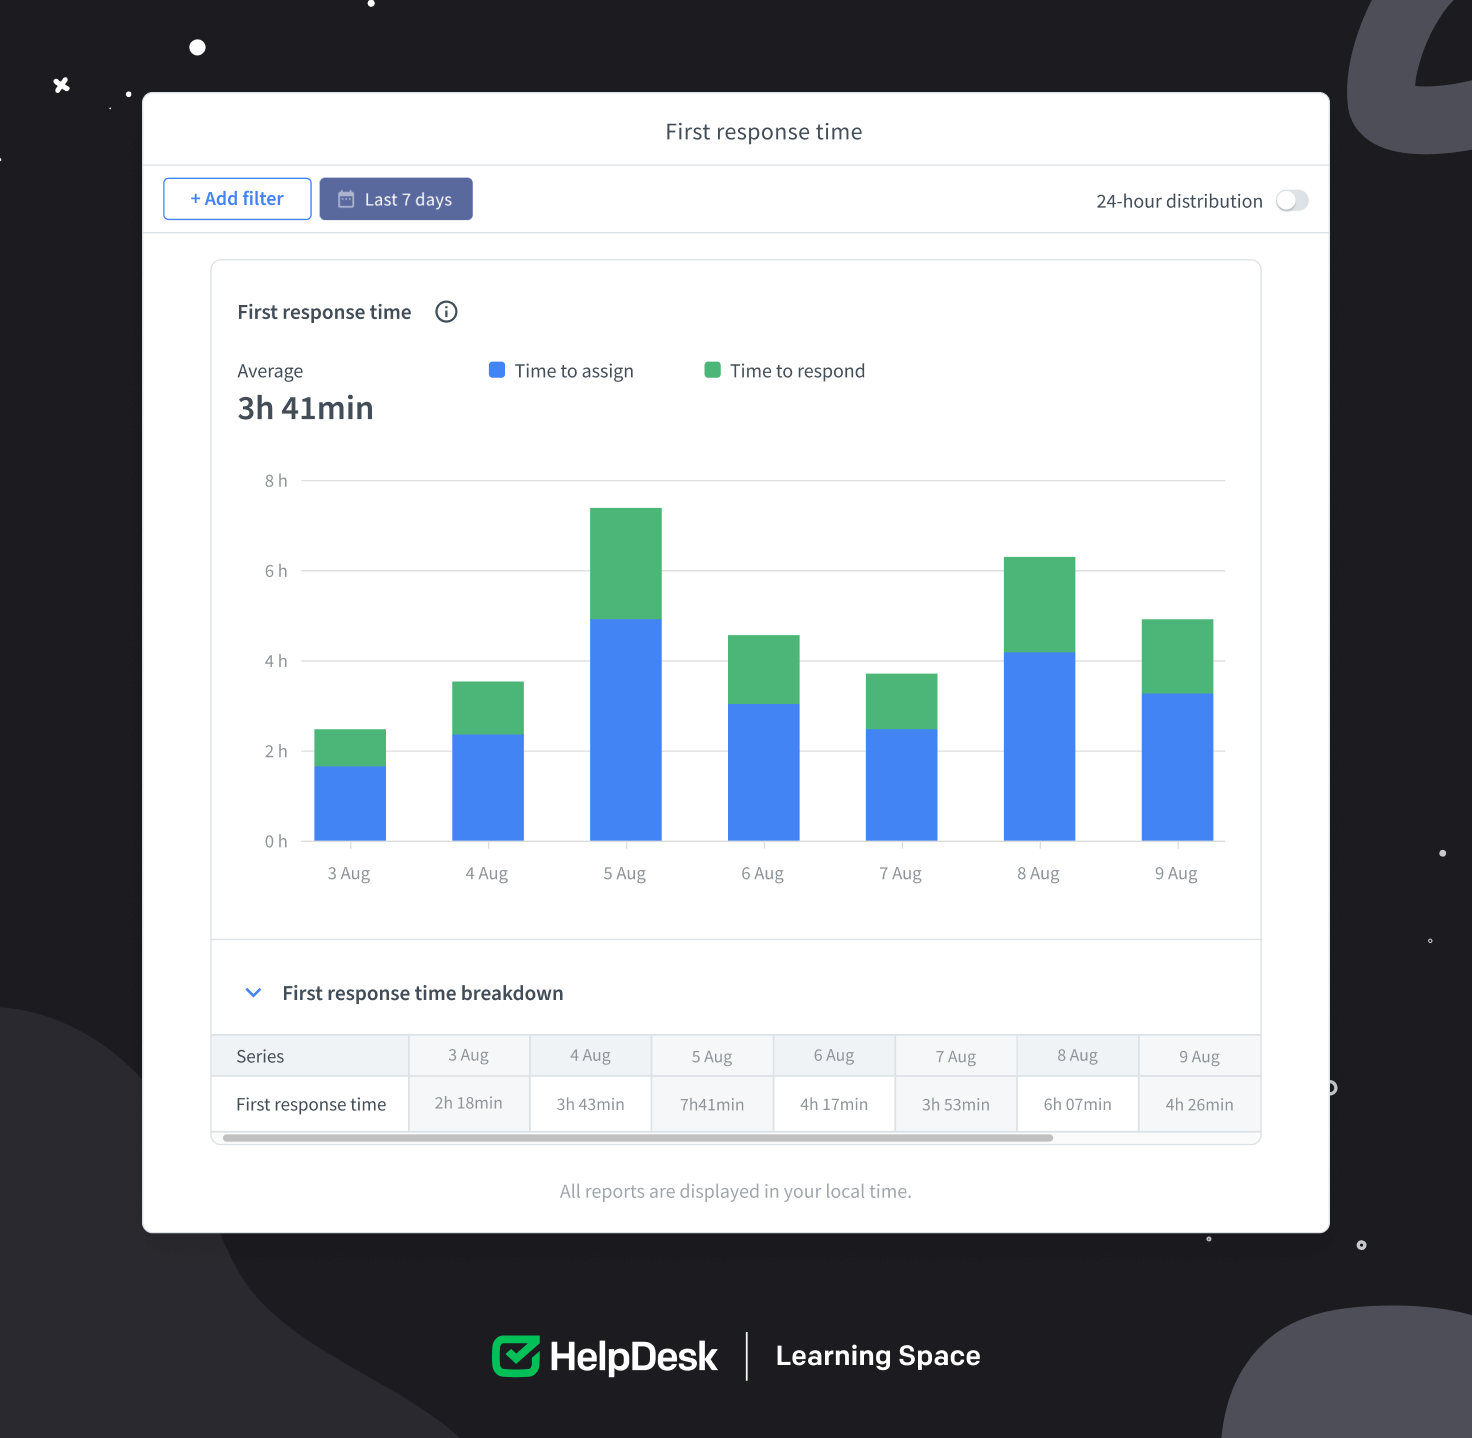 You need to be able to interpret the results you get correctly. A drop in the “First response time” report is always a good sign for you, as your main goal is to provide answers as quickly as possible. There’s a catch here, though.
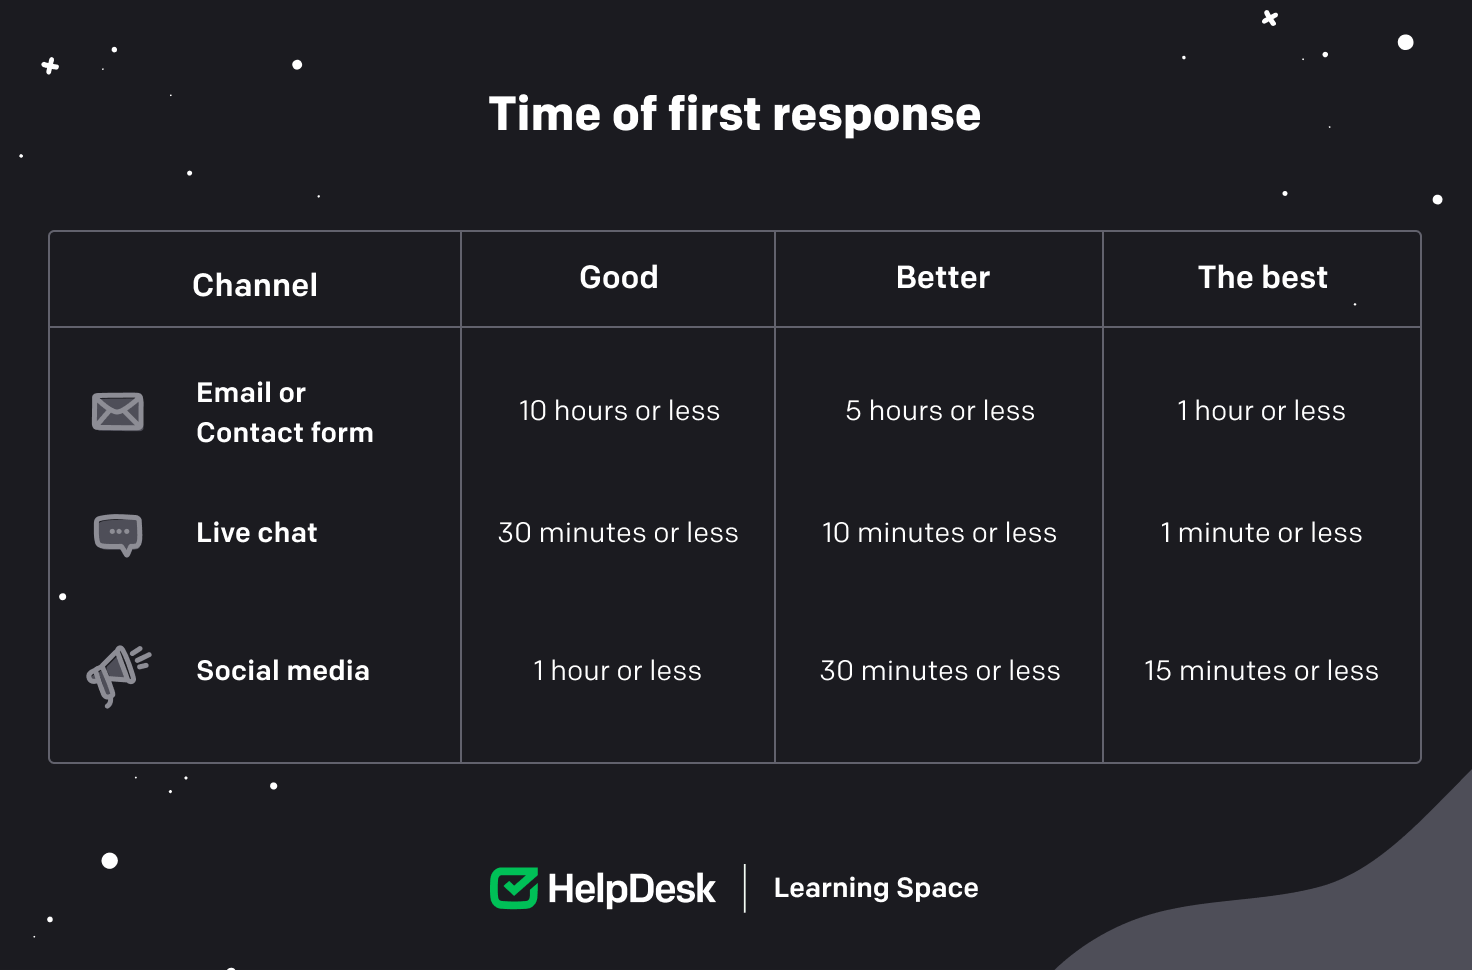
For some customers, two hours as an average first response time is fine. Still, as I mentioned, expectations and needs can vary depending on the industry, communication channel, or customer issue. Your customer service team needs to have the proper benchmark to get the first response time right.
🤔 Want to know your first response time results? Browse them freely on HelpDesk.
Sign up for the 14-day free trial!
Based on a little research and interviews with customers, the table below shows ideal first response times, depending on the communication channel:
A survey by Statista found that 60% of respondents are concerned about long wait times. You can always speed up the first response time with an automated follow-up, confirming that the customer’s message reached you. This will undoubtedly reassure your customer, but not for long. That’s why you can do something else to speed up the response process.
Create helpful canned responses with ready answers to the most common customer questions. One click, and you’re all set! The full answer appears in the message area so that you can meet your targeted first response time.
⚡ Be lightning fast! Use our intuitive automated workflows or helpful canned responses to respond to customers without lifting a finger.
Sign up for a 14-day free trial of HelpDesk and improve your response time.
The average resolution time is the average time it takes to resolve customer cases, that is, to go through all the steps from opening a ticket to marking it as “solved.”
Total resolution time DIVIDED BY Total number of resolved tickets = Average resolution time
This calculation will give you the average amount of time a support agent spends working on solving customer cases.
 This metric is related to team performance: The shorter the time, the less time it takes for your customer service team to mark a ticket as “solved.” Note that success lies in small details. If you can save a few more seconds on handling customer cases, it can result in considerable savings in money or time to focus on complex issues.
If you want to address this metric like a pro, first properly organize your customer support team. Ensure adequate staffing so that speed of assistance isn’t affected. Also, educate your support team to be ready for any challenge so that fewer messages are exchanged to close a customer’s case. If you notice that some issues take longer to resolve, try to understand them as this could be due to poor customer experience or process optimization.
Sign up and get a guide!
Join our mailing list and get your awesome Business Email Writing guide.
The ticket volume is the total number of tickets (or rather, customer conversations) that the support team has in the selected period.
Total tickets for the selected period = Ticket volume
 The calculation is pretty cut and dried, but the metric is still vital because it gives you an overall picture of your support team’s workload. If you care about the well-being of support agents, then you should definitely track it to identify patterns among increasing or decreasing tickets over time.
Any unusual growth can be a sign that something’s going on. It could be a severe problem, like a faulty promo code or a broken feature in your product. But it could also be related to the holiday season or another special event. However, when you notice a strange spike, you know that additional agents are needed to troubleshoot the issues.
🧑💼 Have all tickets on a single HelpDesk dashboard and always know what volume your support agents are dealing with.
Sign up for the 14-day free trial!
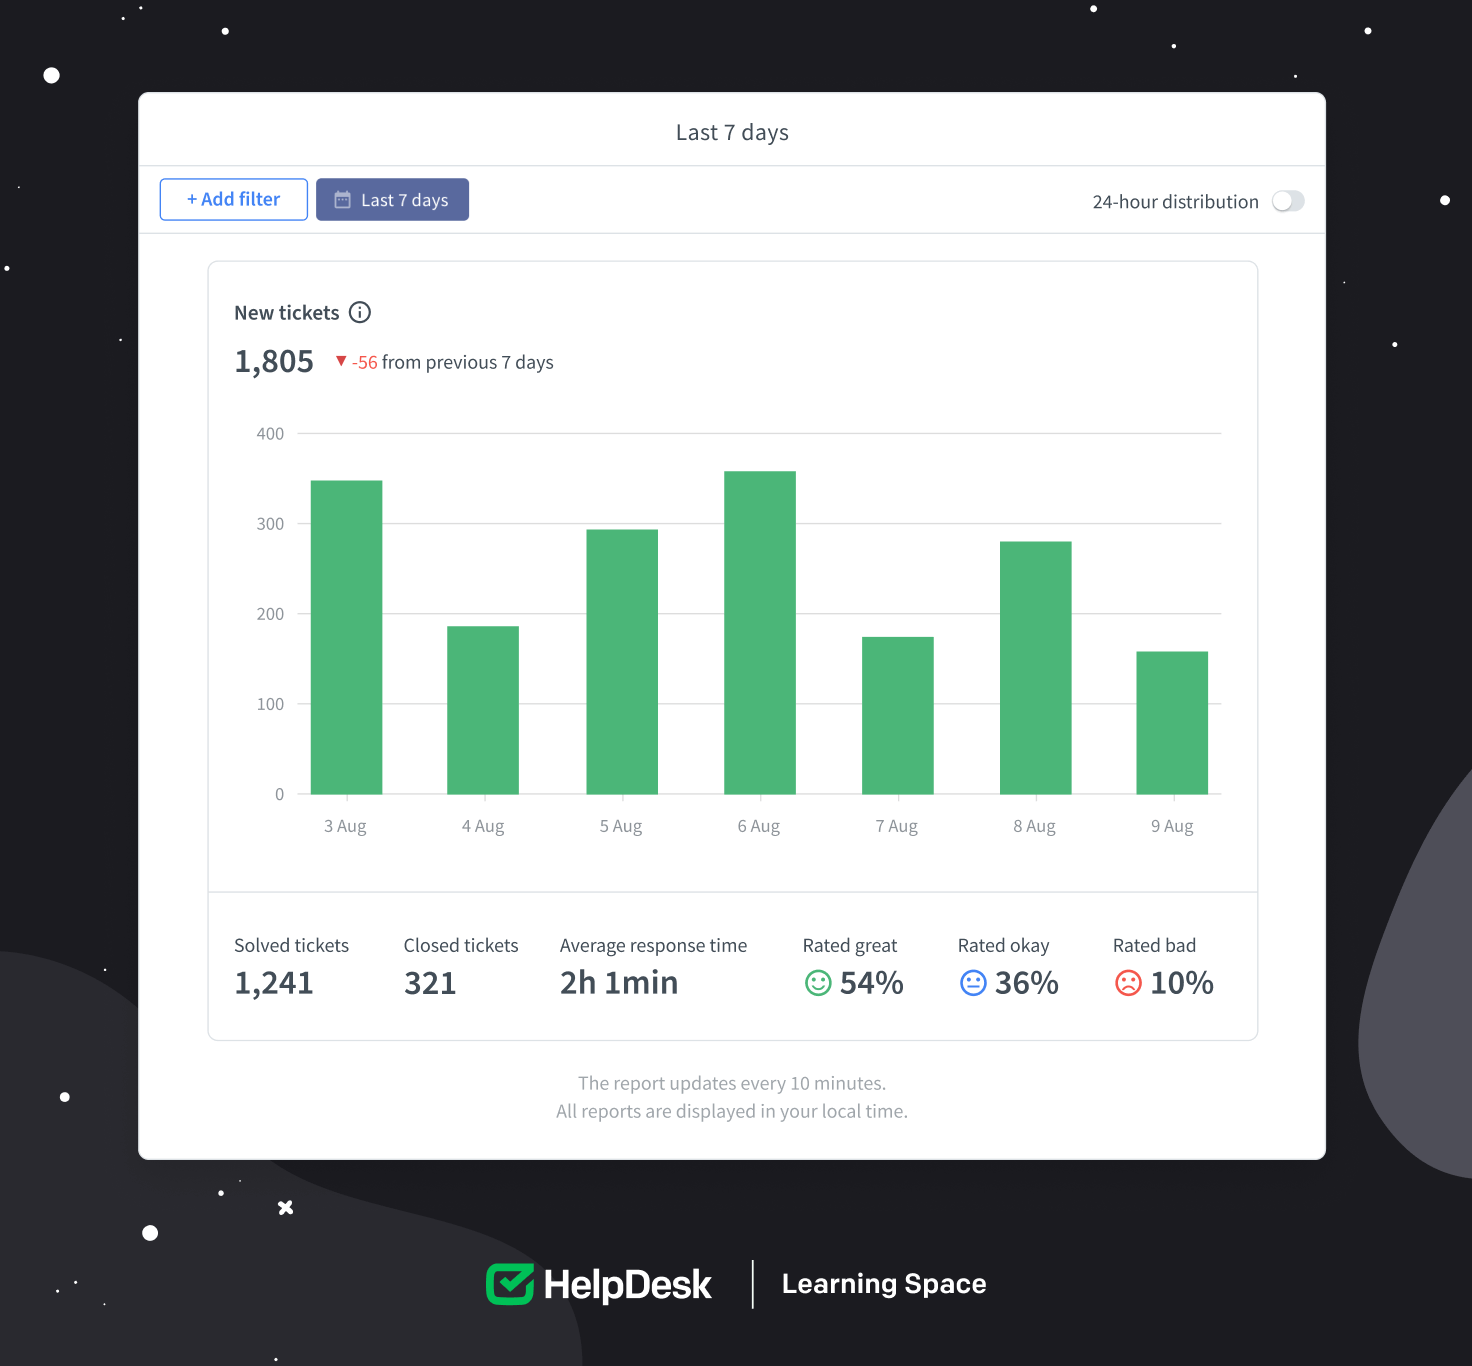
You can start tracking ticket volume metrics in your HelpDesk account. Explore the “New tickets” report to get a general idea of how many of your customers needed help during the selected period. Even more surprisingly, you’ll also find out how they contacted you.
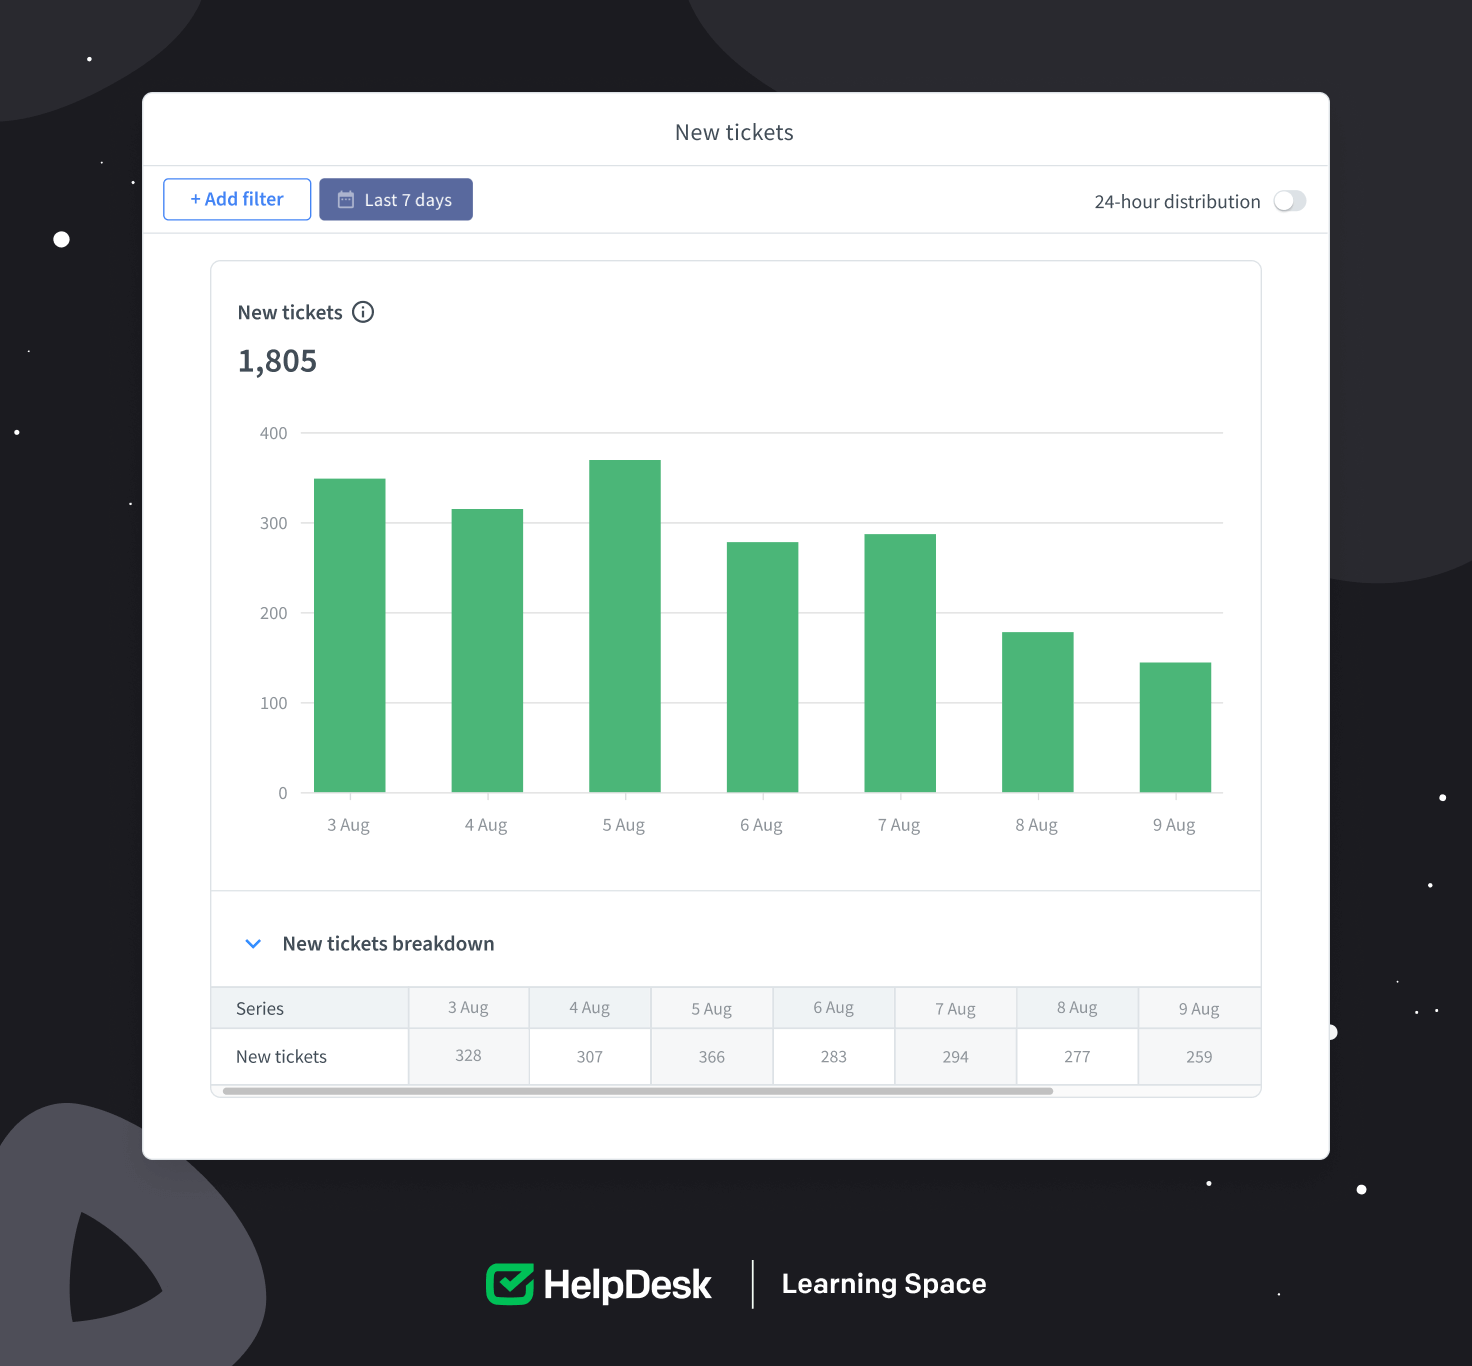 Below the chart, you can see the ticket sources, or in other words, the communication channels your customers used to contact you. Take a look at the screenshot, taken from the “New tickets” report, and you’ll see the channels: Email, Entered manually (dedicated installation), and the Contact form.
In the HelpDesk app, you can combine multiple channels to collect all customer messages in one place and keep your workflow organized. Explore the “New tickets” report to spot the trends and see how your support work can impact this number.
If you’re a support agent and your bread and butter is serving customers, you’ll be interested in another report available in HelpDesk. The “Last seven days” report will show you how much work you put in to provide the best customer experience. Besides a summary of your progress in resolving tickets, you’ll also find the customer ratings you received for your efforts. There’s nothing better than being recognized for your work.
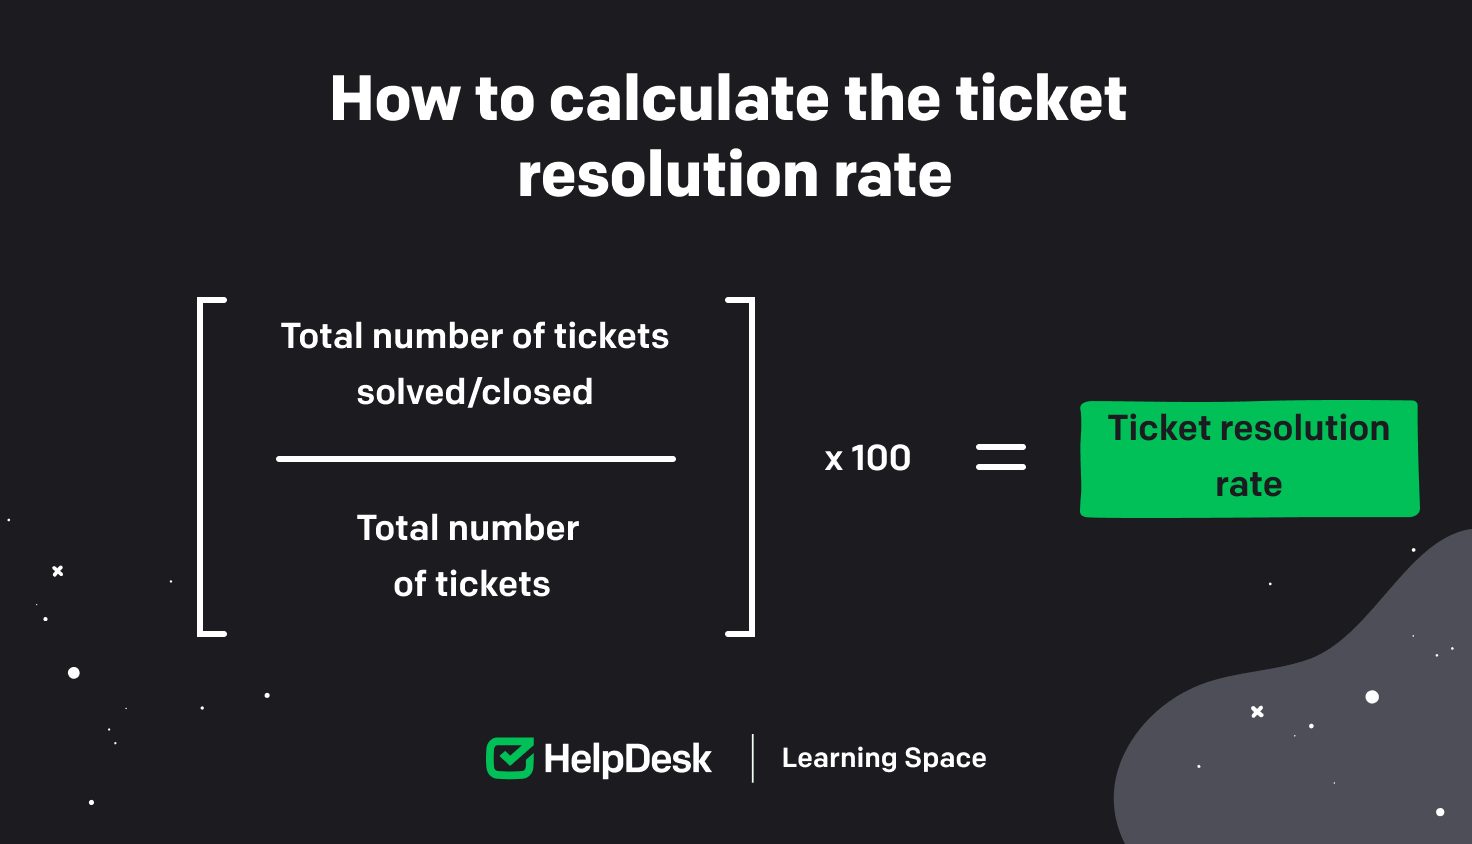
Ticket resolution rate is the ratio of the number of tickets assigned to a support agent to the number of tickets solved by them in a selected period.
Total number of tickets solved/closed DIVIDED BY Total number of tickets x 100 = Ticket resolution rate
If you calculate this, you get a percentage for the total resolution rate. The higher the percentage, the more tickets you marked as “solved,” consequently reducing the number of tickets to be served on the ticket list.
 It’s up to you whether you track solved or closed tickets to calculate your resolution rate, but note that these two statuses have different meanings:
You choose “Solved” status when you’re sure that you’ve provided your customer with the necessary answers and left them satisfied.
You choose “Closed” status when you receive a message with information that doesn’t apply to you or your team, such as a marketing or collaboration offer. You can also treat the “closed” status as the last step in the ticket resolution process and use it when the predefined time has passed. That way, all your teammates will know that this ticket is done and should be left untouched.
You can use your resolution rate to assess whether your customer service agents are solving customer tickets in a timely manner. Also, you can determine the overall performance of your customer service team. I’ll add one more piece of advice here: If you know your resolution rate, you can easily decide whether or not you’re meeting your service level agreement (SLA) that you’ve established with the VIP customers. Pretty helpful, right?
In the HelpDesk ticketing software, one of the reports is “Solved and closed,” which shows how many customer tickets were marked as “solved” or “closed” compared to the total number of tickets received in a given period.
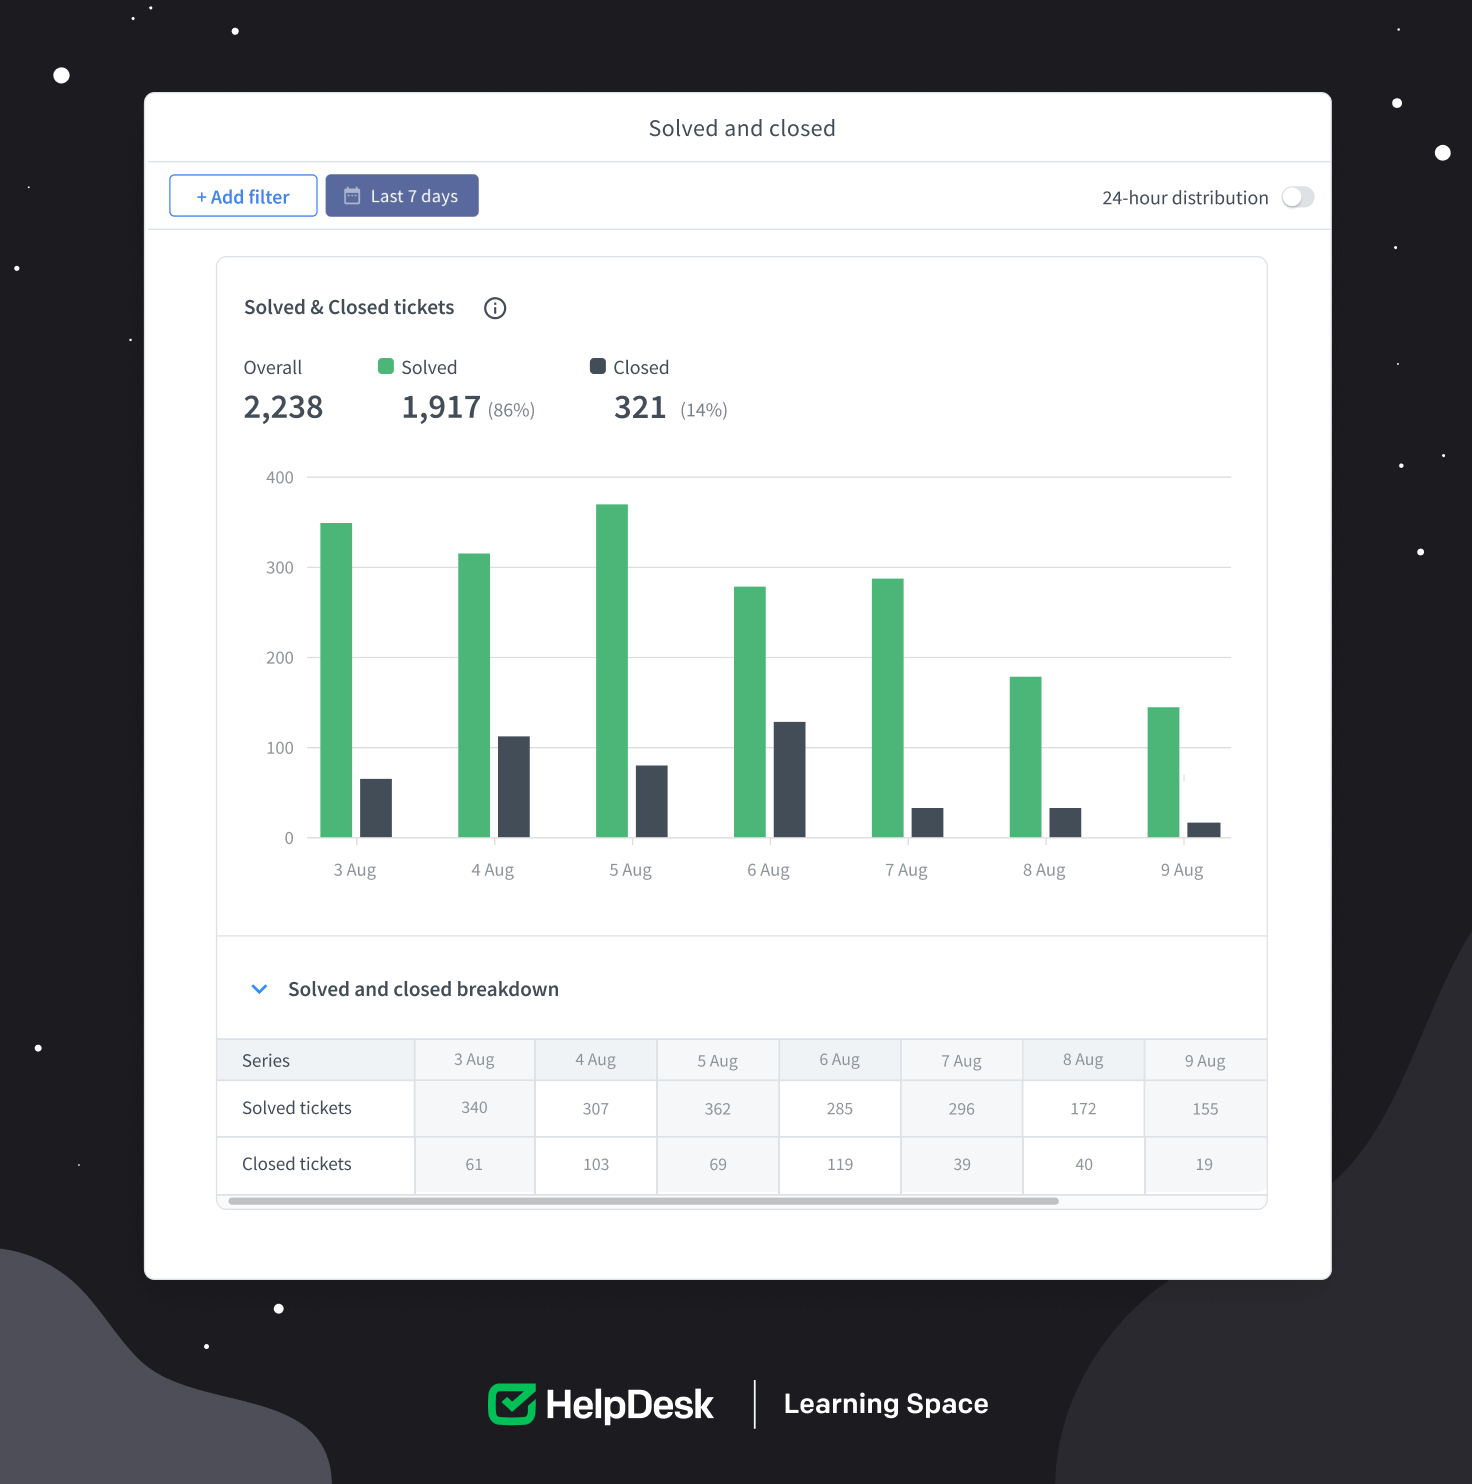 Solved and closed tickets reflect your team’s performance, process efficiency, and information flow among team members. When you get a message with a question or a customer complaint, your goal is to close the loop and resolve the case as quickly as possible.
Always finish your support agent shift confident that all customer tickets have one of these statuses in the ticket management system. I know that sometimes this is impossible because cases vary in complexity, but you get the point.
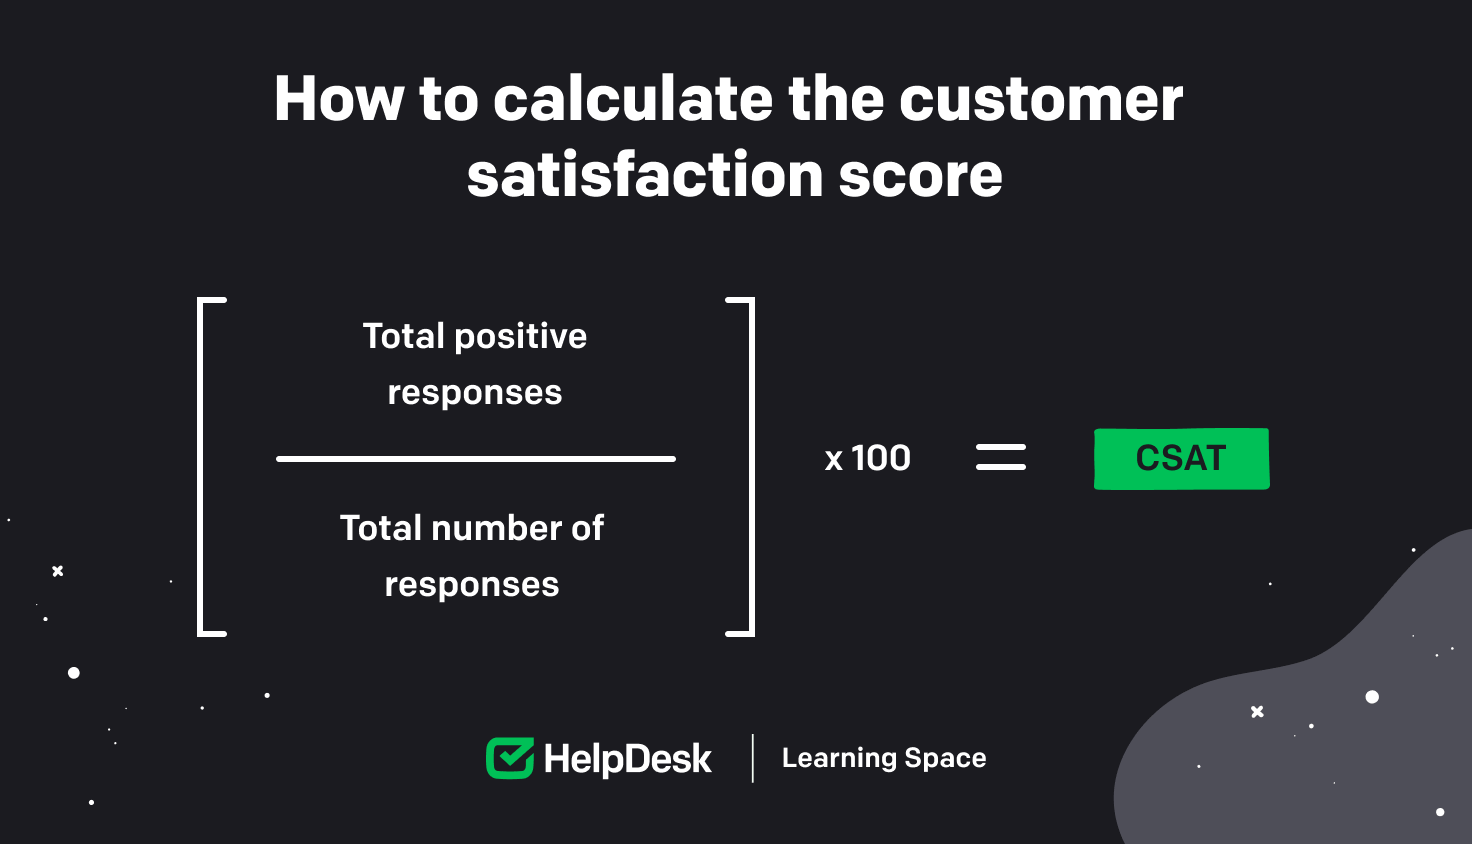
The customer satisfaction score shows how satisfied your customers are with your product/service or daily support. It’s the customer’s subjective assessment of your efforts, created from their “good feelings” as well as “hard evidence,” such as response time or availability of helpful resources.
Total positive responses DIVIDED BY Total number of responses MULTIPLIED BY 100 = CSAT
The customer satisfaction score (CSAT) is expressed as a percentage. The higher the rate, the more positive reviews you received in a given period, and the more customers you left satisfied.
 When you talk to a customer, you think about making a good impression. I bet you’re helpful, prompt, and proactive, not only because it’s in your nature, but also because you want to hear “Thank you, I’m glad I came across you to help with my issue,” at the end of the conversation. A customer satisfaction score will give you a true picture of how your customers feel after interacting with you.
Once you resolve the ticket, ask for a rating of your service to find out how you did. Send your customer the short survey to get ratings on a predefined scale, such as 1-3, 1-5, or 1-10. To increase the chances of getting an answer, use straightforward wording by simply asking, “How satisfied are you with my assistance? Please rate your experience on a scale of 1-5, where one means bad and five means excellent.”
Now, speaking of results, if you get a higher rating, you did a good job. Congratulations! Your efforts add up, and if you keep it up this way, you may be rewarded through an employee recognition program. But, if you get a lower rating, it should raise alarm bells because something went wrong during the customer journey. Write a follow-up message to hit the nail on the head and get a better rating next time.
Use HelpDesk to ask for customer feedback automatically and generate your “Ticket satisfaction” report. Track your results and use the two highest values: “Great” and “Okay” in customer satisfaction surveys to predict customer retention.
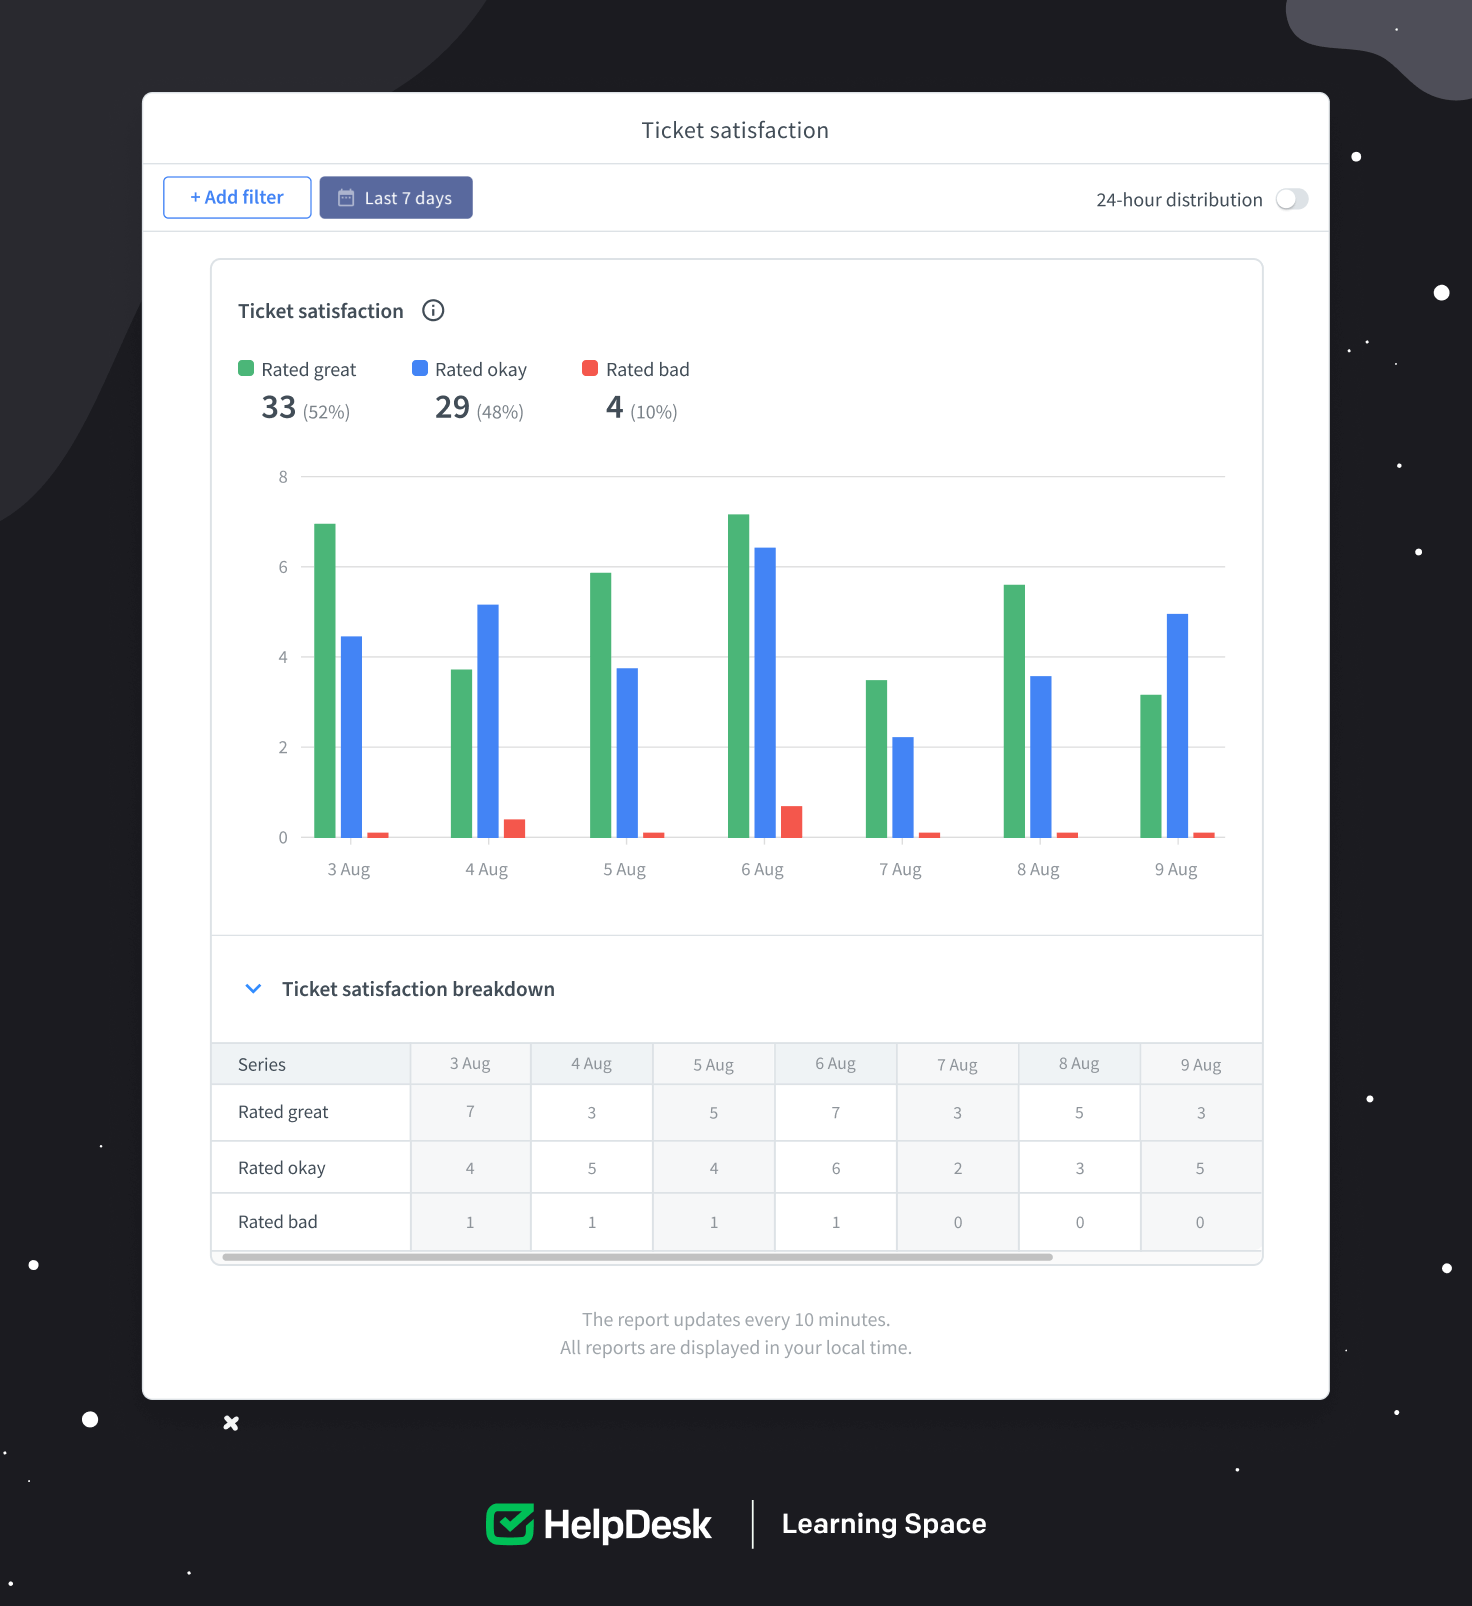
Don't lose sight of your customer service results. Sign up for a 14-day free trial of HelpDesk. Handle each customer request smartly and then enjoy robust, real-time reporting.
This lesson was all about customer support metrics that you should focus on. I listed a few of them that will definitely bring consistency to your highly subjective support actions and reduce customer friction. Find your customer care metrics today and be fully prepared for tomorrow’s challenges. Now, let’s wrap up this lesson with a few takeaways:ńthe ess
Set SMART goals for customer service and keep in mind the specifics of a customer service agent’s work. Some activities are easier to collect and measure, while others are more challenging. Don’t forget to take a holistic view of your team’s performance.
Make sure the metrics are present in your business from day one. Your agents will approach their work with more enthusiasm, and you can expand the metrics later.
Record in detail when you make any changes to your customer service workflow. This is important because even minor tweaks can make your results better or worse.
You don’t have to do all the metric calculations yourself, because you can easily track them with HelpDesk reports generated in real time specifically for you.
Conduct regular training sessions for your support agents to keep them up to date with business information. This will help them answer even the most complicated questions in a professional and timely manner.
Subscription with a gift!
Join the mailing list to get a special ebook on email communication.
Try HelpDesk for free
For quick and intuitive tickets management